EXPERIMENT
───── ⬢ ⬢ ⬢ Nanoparticles ⬢ ⬢ ⬢ ──────
Nanoparticles
1. MNP Synthesis:
a. Background:
The coprecipitation method is a widely used technique for synthesizing magnetite nanoparticles (Fe₃O₄) due to its simplicity, cost-effectiveness, and ability to control particle size. This method relies on the simultaneous reduction and precipitation of iron salts in an alkaline environment, resulting in the formation of nanoscale magnetite. In this approach, ferric (Fe³⁺) and ferrous (Fe²⁺) ions are dissolved in water at a molar ratio of 2:1, typically under an inert (nitrogen or argon) atmosphere to prevent unwanted oxidation. The solution is then exposed to a strong base, which raises the pH and triggers nucleation. Under alkaline conditions, Fe²⁺ and Fe³⁺ ions react, forming magnetite through the following reactions:
\({Fe}^{3+}+3{OH}^-\ \rightarrow\ Fe\left(OH\right)_3\left(s\right)Fe\left(OH\right)_3\left(s\right)\rightarrow\ FeOOH\left(s\right)+H_2O\)
\({Fe}^{2+}+2{OH}^-\ \rightarrow\ Fe\left(OH\right)_2\left(s\right)\)
\(2FeOOH\left(s\right)+Fe\left(OH\right)_2\left(s\right)\ \rightarrow\ {Fe}_3O_4\left(s\right)+2H_2O\)
\(2{Fe}^{3+}+\ {Fe}^{2+}+8{OH}^-\ \rightarrow2Fe\left(OH\right)_3Fe\left(OH\right)_2\ \rightarrow\ {Fe}_3O_4\left(s\right)+H_2O\)
Fig 1.1: Co-precipitation method of MNP synthesis
This controlled nucleation and growth process enables the formation of stable, uniformly sized MNPs. Reaction conditions—including temperature, pH, and stirring speed—are adjusted to control particle size. The particles are coated with citric acid and then separated magnetically, washed to remove impurities, and stored under specific conditions to maintain their stability and prevent agglomeration.
b. Material and Methods:
Materials: Iron (III) chloride (FeCl₃·6H₂O), Iron (II) chloride (FeCl₂·4H₂O), sodium hydroxide (NaOH), deionized water.
Procedure
- i. Preparation of Solution: FeCl₃·6H₂O and FeCl₂·4H₂O were dissolved in deionized water in a 2:1 molar ratio under a nitrogen atmosphere to prevent oxidation.
- ii. Formation of Magnetite Nanoparticles: Aqueous NaOH was added dropwise, increasing the pH. The solution turned black, indicating MNP formation.
- iii. Stirring: The reaction was stirred for an additional 30 minutes to ensure complete formation.
- iv. Heating: The suspension was heated at 65°C for 10 to 20 minutes
- v. Magnetic Separation and Washing: The MNPs were separated magnetically and washed multiple times with deionized water to remove any unreacted materials, yielding pure Fe₃O₄ nanoparticles.
Optimization: Parameters such as pH, temperature, and reaction time were optimized to ensure a uniform size distribution and high magnetic properties.
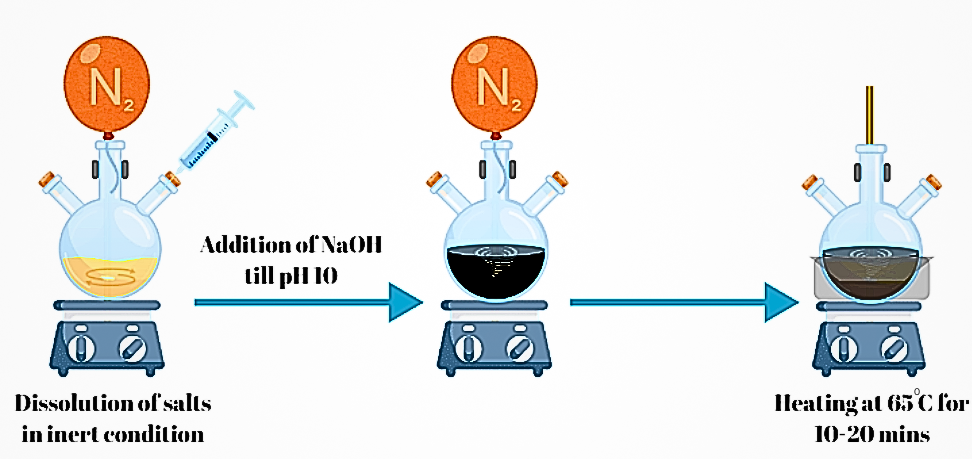
Fig 1.2: Synthesis of MNPs
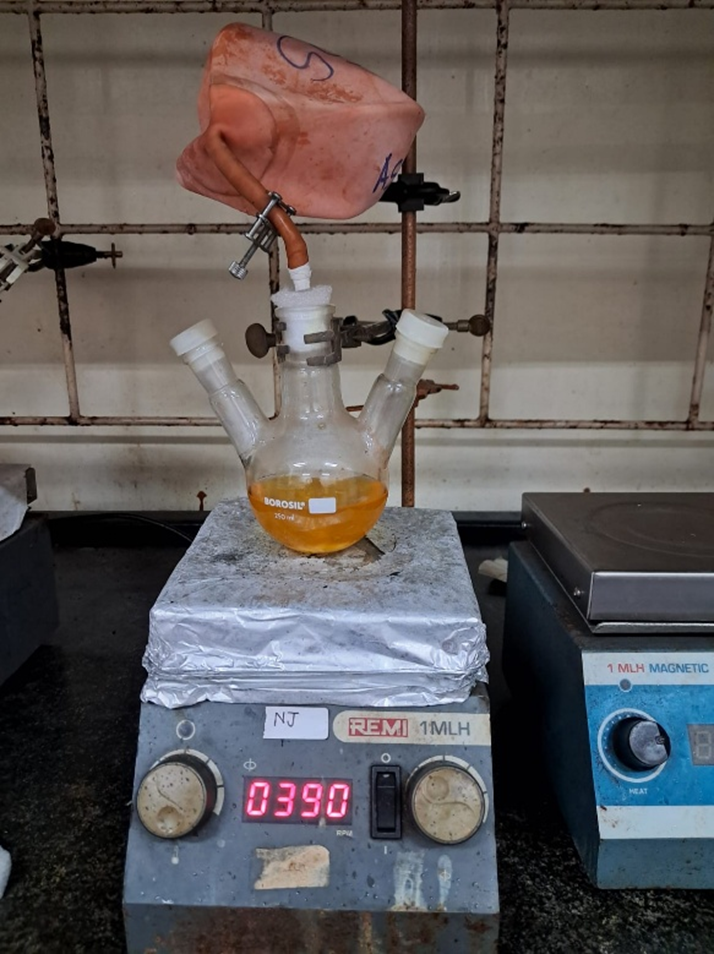
Fig 1.3: MNP synthesis at ICT Mumbai
2. Carboxyl Functionalisation:
a. Background:
Carboxyl functionalization of magnetite nanoparticles (MNPs) enhances enzyme immobilization by introducing reactive carboxyl (-COOH) groups on the nanoparticle surface. These groups facilitate covalent bonding with amino groups present in enzymes, such as carbonic anhydrase (CA). This functionalization not only stabilizes the enzyme attachment but also optimizes the enzyme orientation and accessibility on the nanoparticle surface, thereby improving catalytic activity and reusability of the enzyme-functionalized MNPs in CO₂ sequestration applications.
b. Material and Methods:
Materials: Synthesized MNPs, citric acid, deionized water.
Procedure
- i. Citric Acid Coating: A 1M citric acid solution was added dropwise to the MNP suspension.
- ii. Heating and Mixing: The mixture was heated to 60-70°C and stirred for 10 minutes, allowing citric acid to coat the MNPs and introduce carboxyl groups on the surface.
- iii. Washing and Magnetic Separation: The functionalized MNPs were washed with deionized water and separated magnetically to remove unreacted citric acid and impurities.
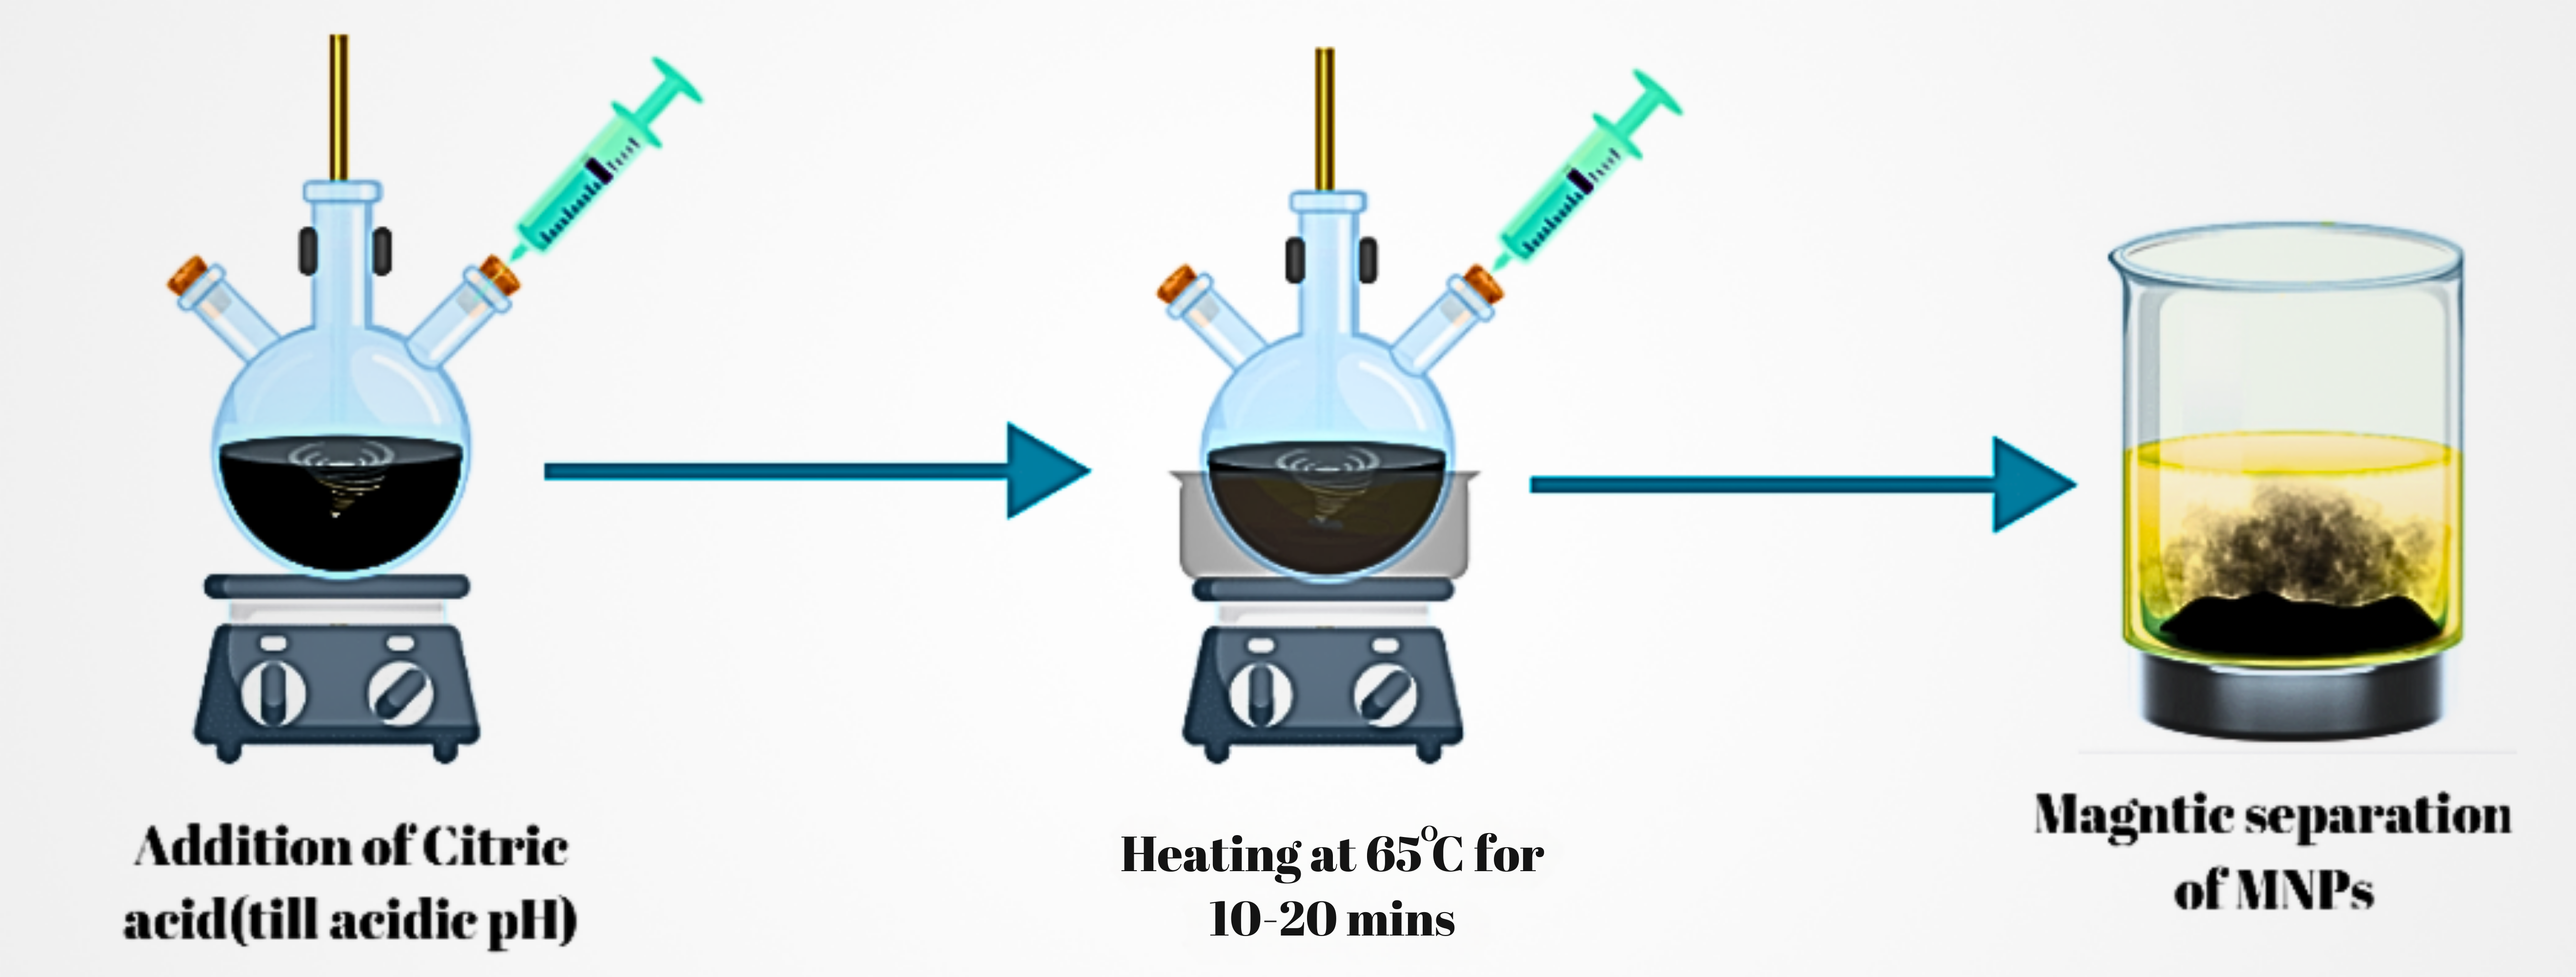
Fig 2.1: Procedure of carboxyl functionalization of MNPs
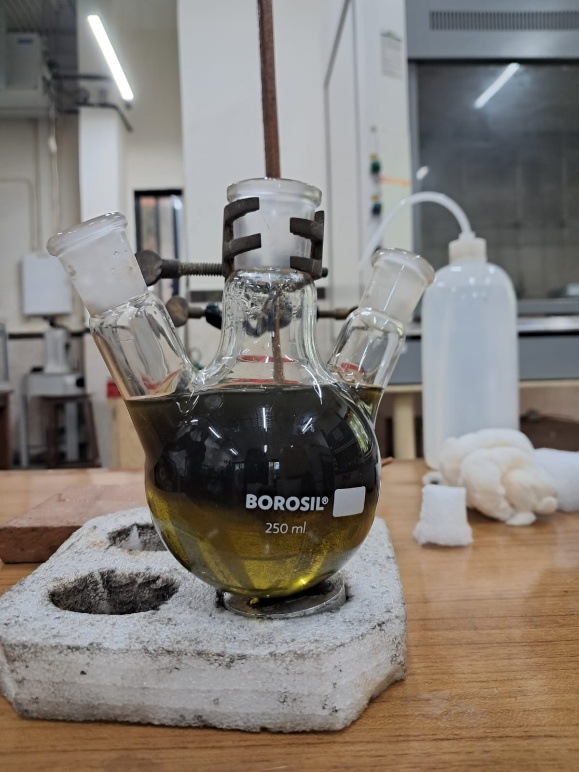
Fig 2.2: Functionalization of MNPs at ICT Mumbai
3. Characterisation:
- X-Ray Diffraction (XRD): XRD analysis confirmed the formation of magnetite. The diffraction pattern showed characteristic peaks that matched the standard for magnetite (Fe₃O₄), confirming a Face Centred Cubic Spinal Structure crystal.
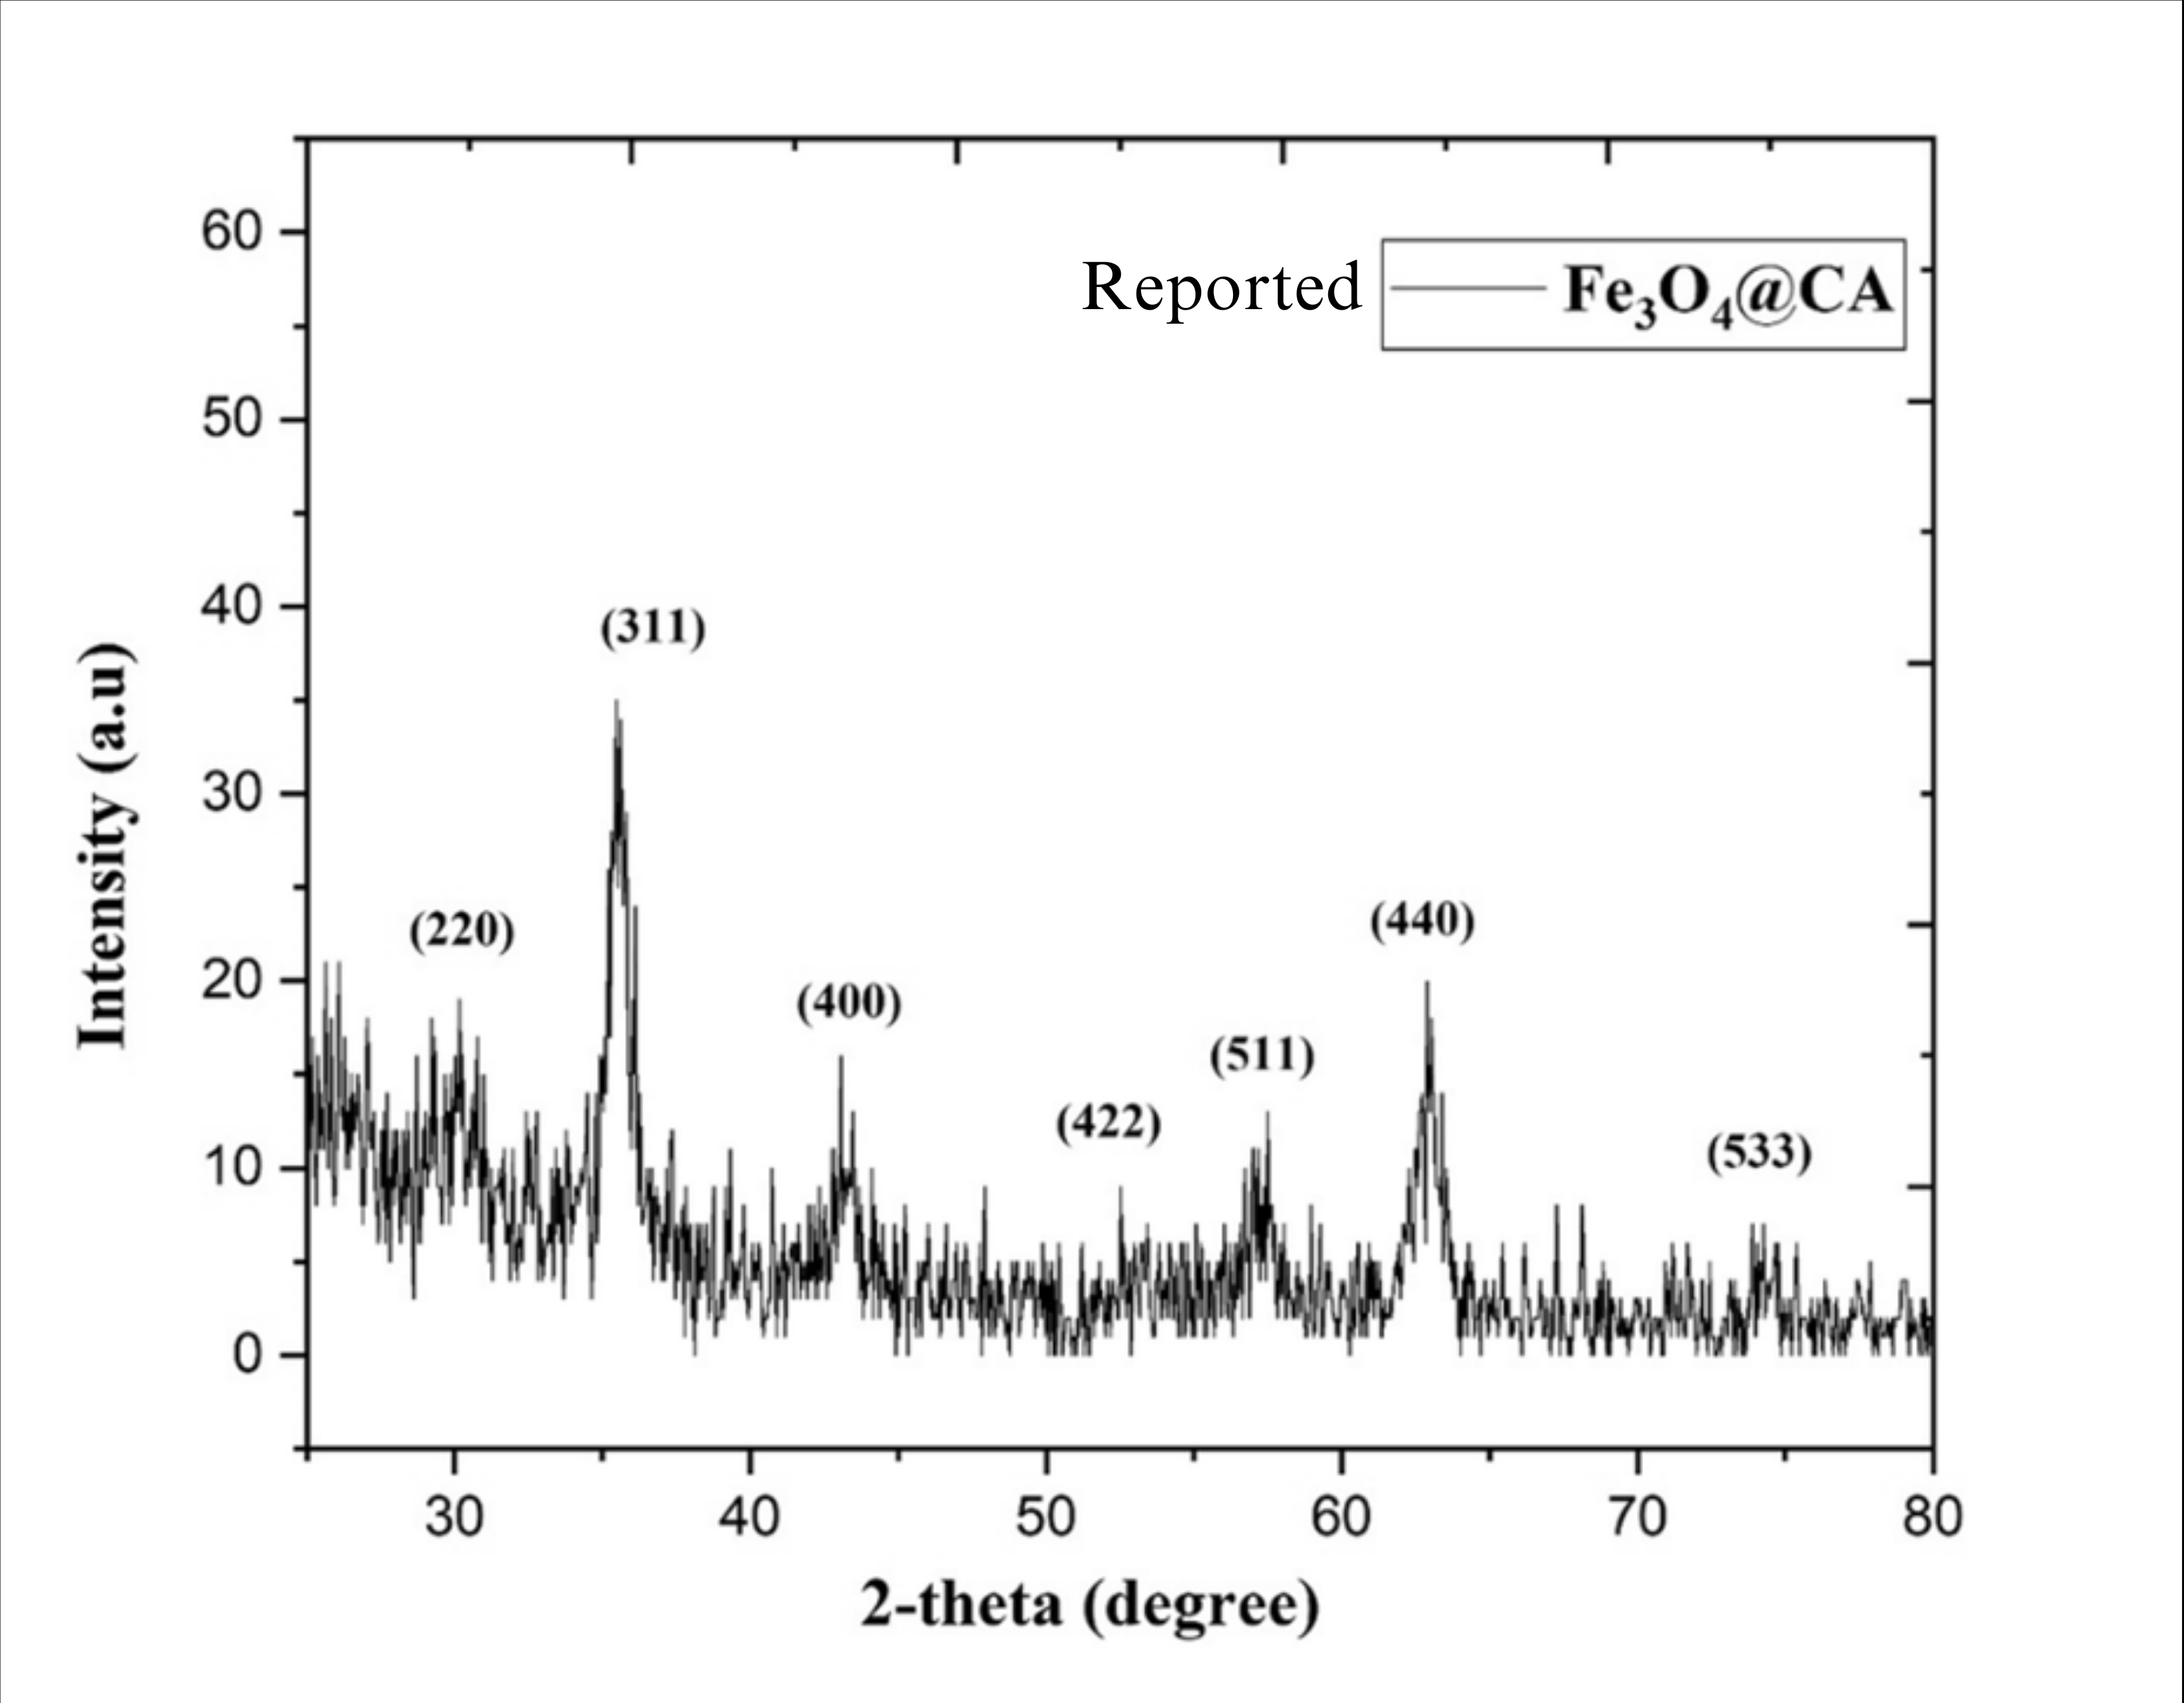
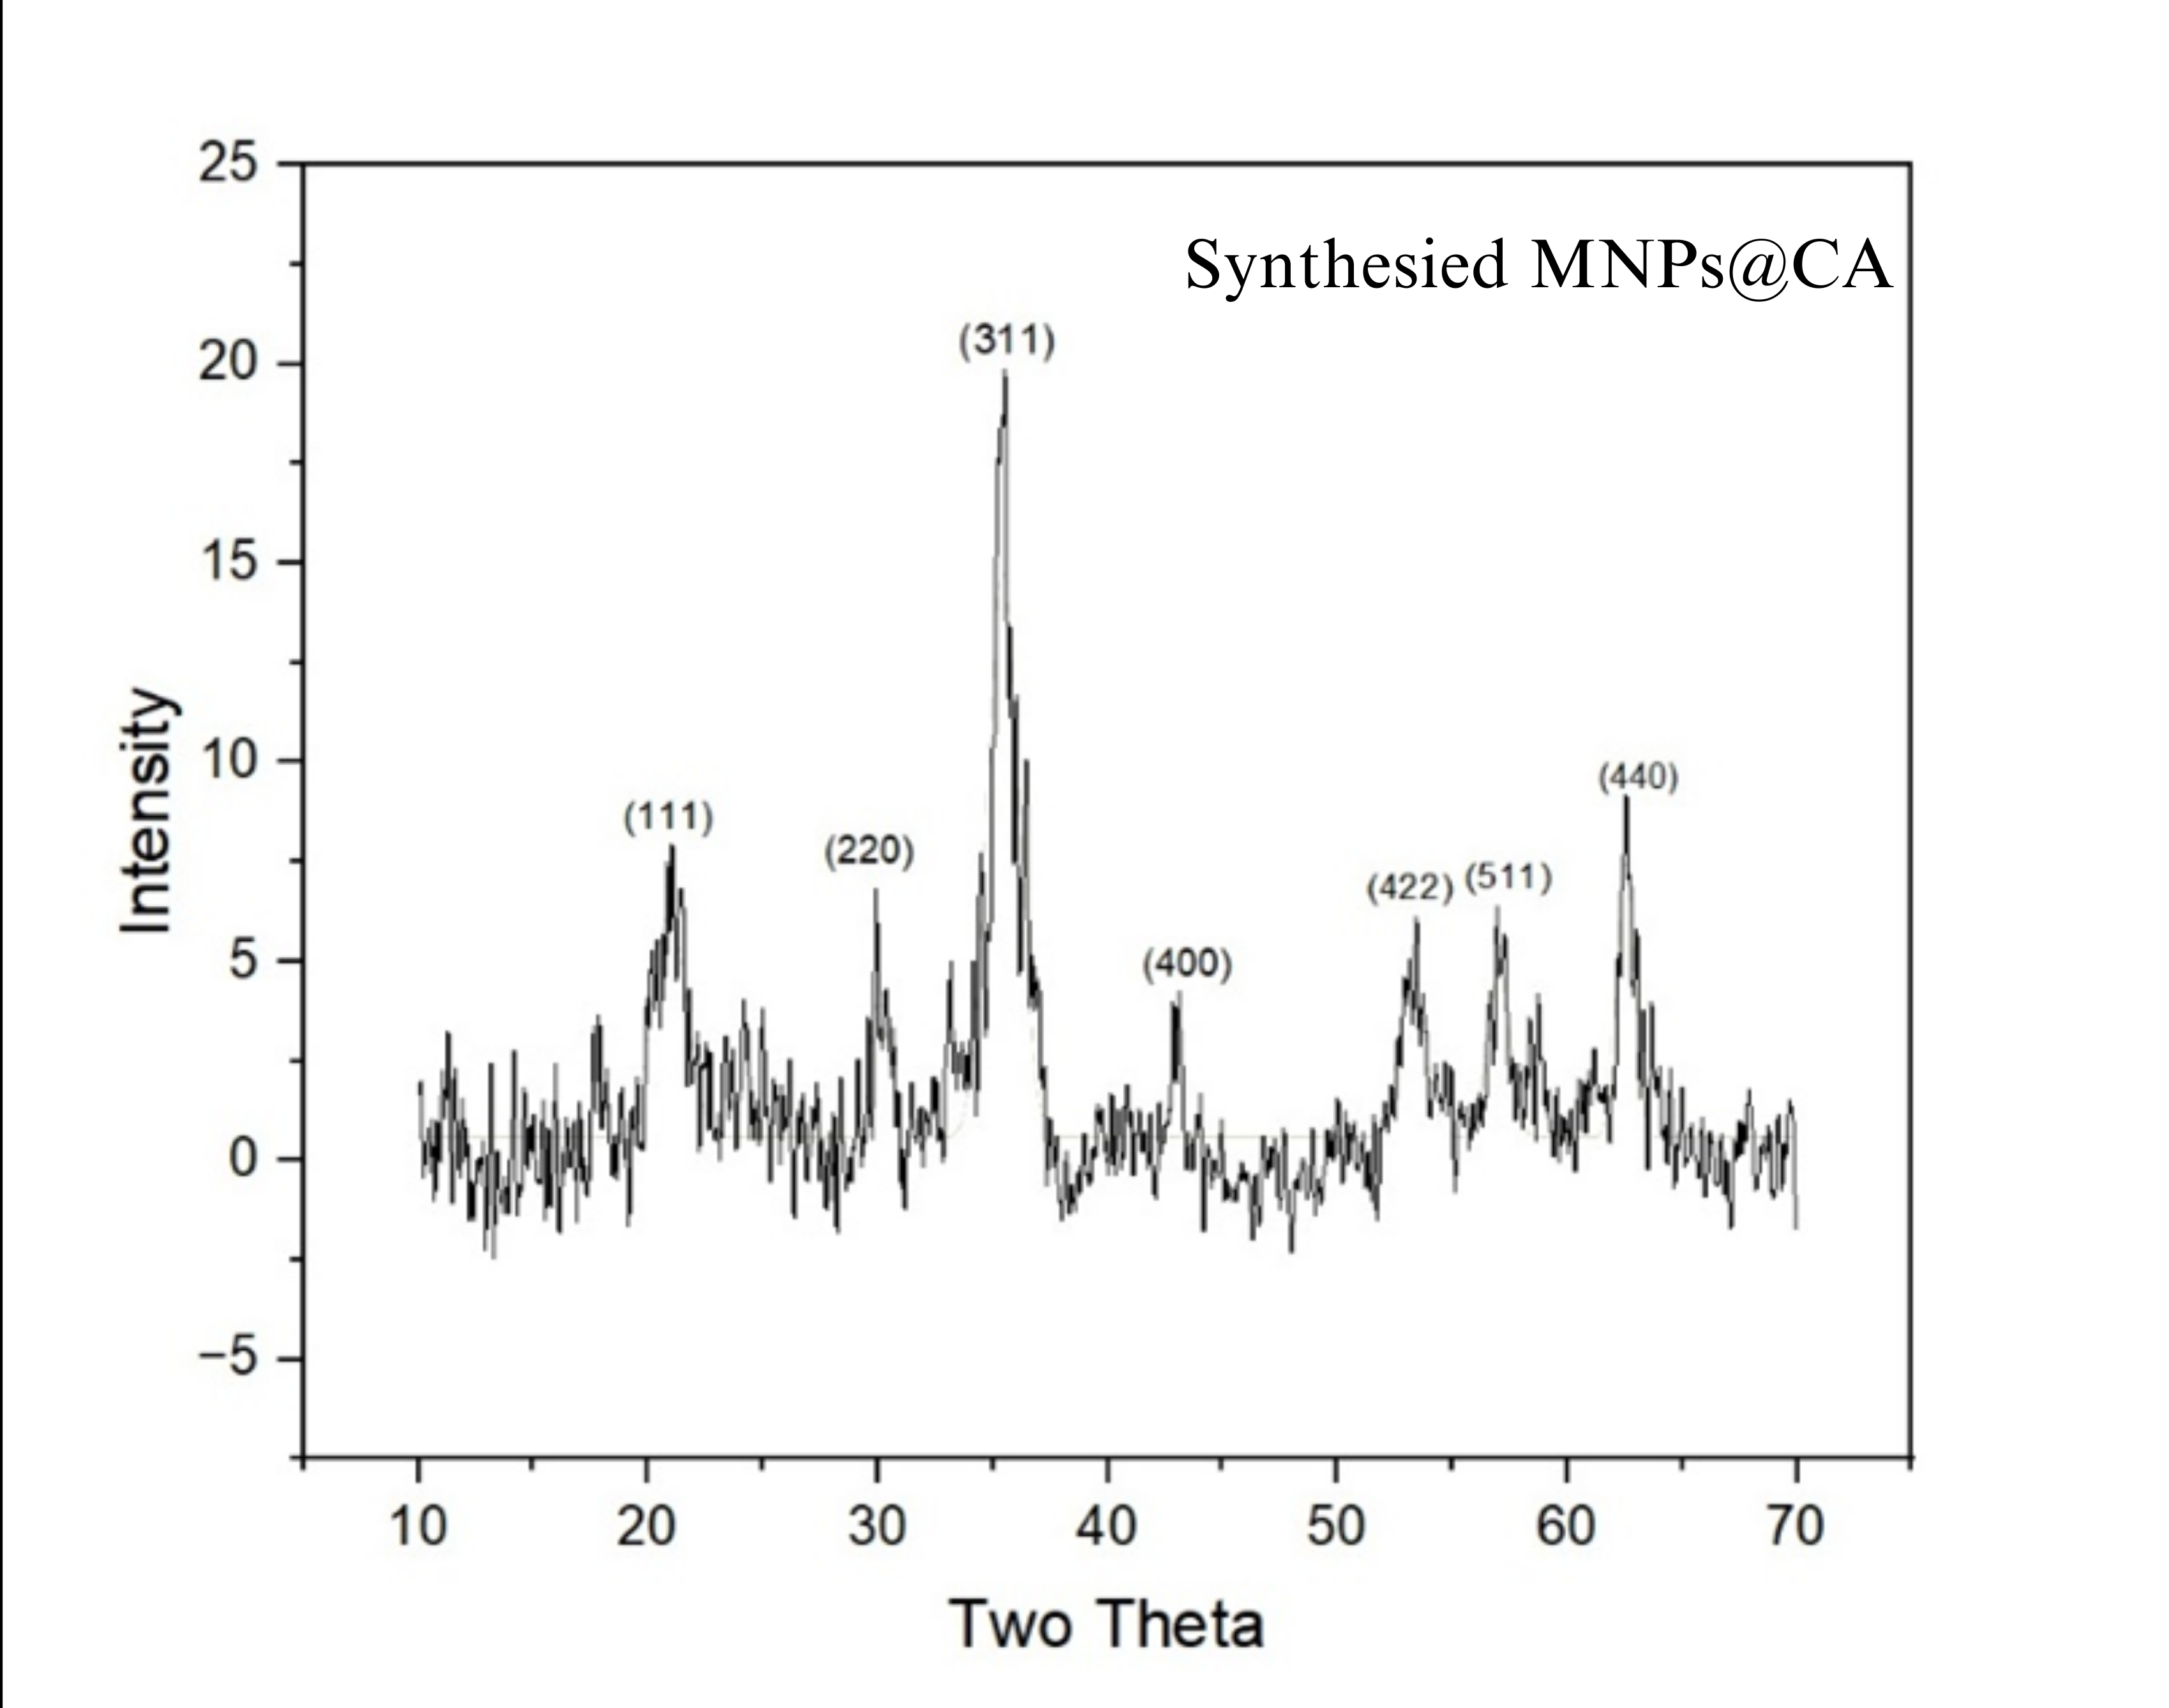
Fig 3.1: XRD graphs of magnetite nanoparticles: Standard (left) and experimentally obtained (right)
Fig 3.1: XRD graphs of magnetite nanoparticles: Standard (top) and experimentally obtained (bottom)
- Fourier-Transform Infrared Spectroscopy (FT-IR): FT-IR analysis confirmed successful functionalization. A peak at 1618 cm⁻¹ indicated the presence of carboxyl groups on the surface, confirming citric acid attachment to the MNPs.
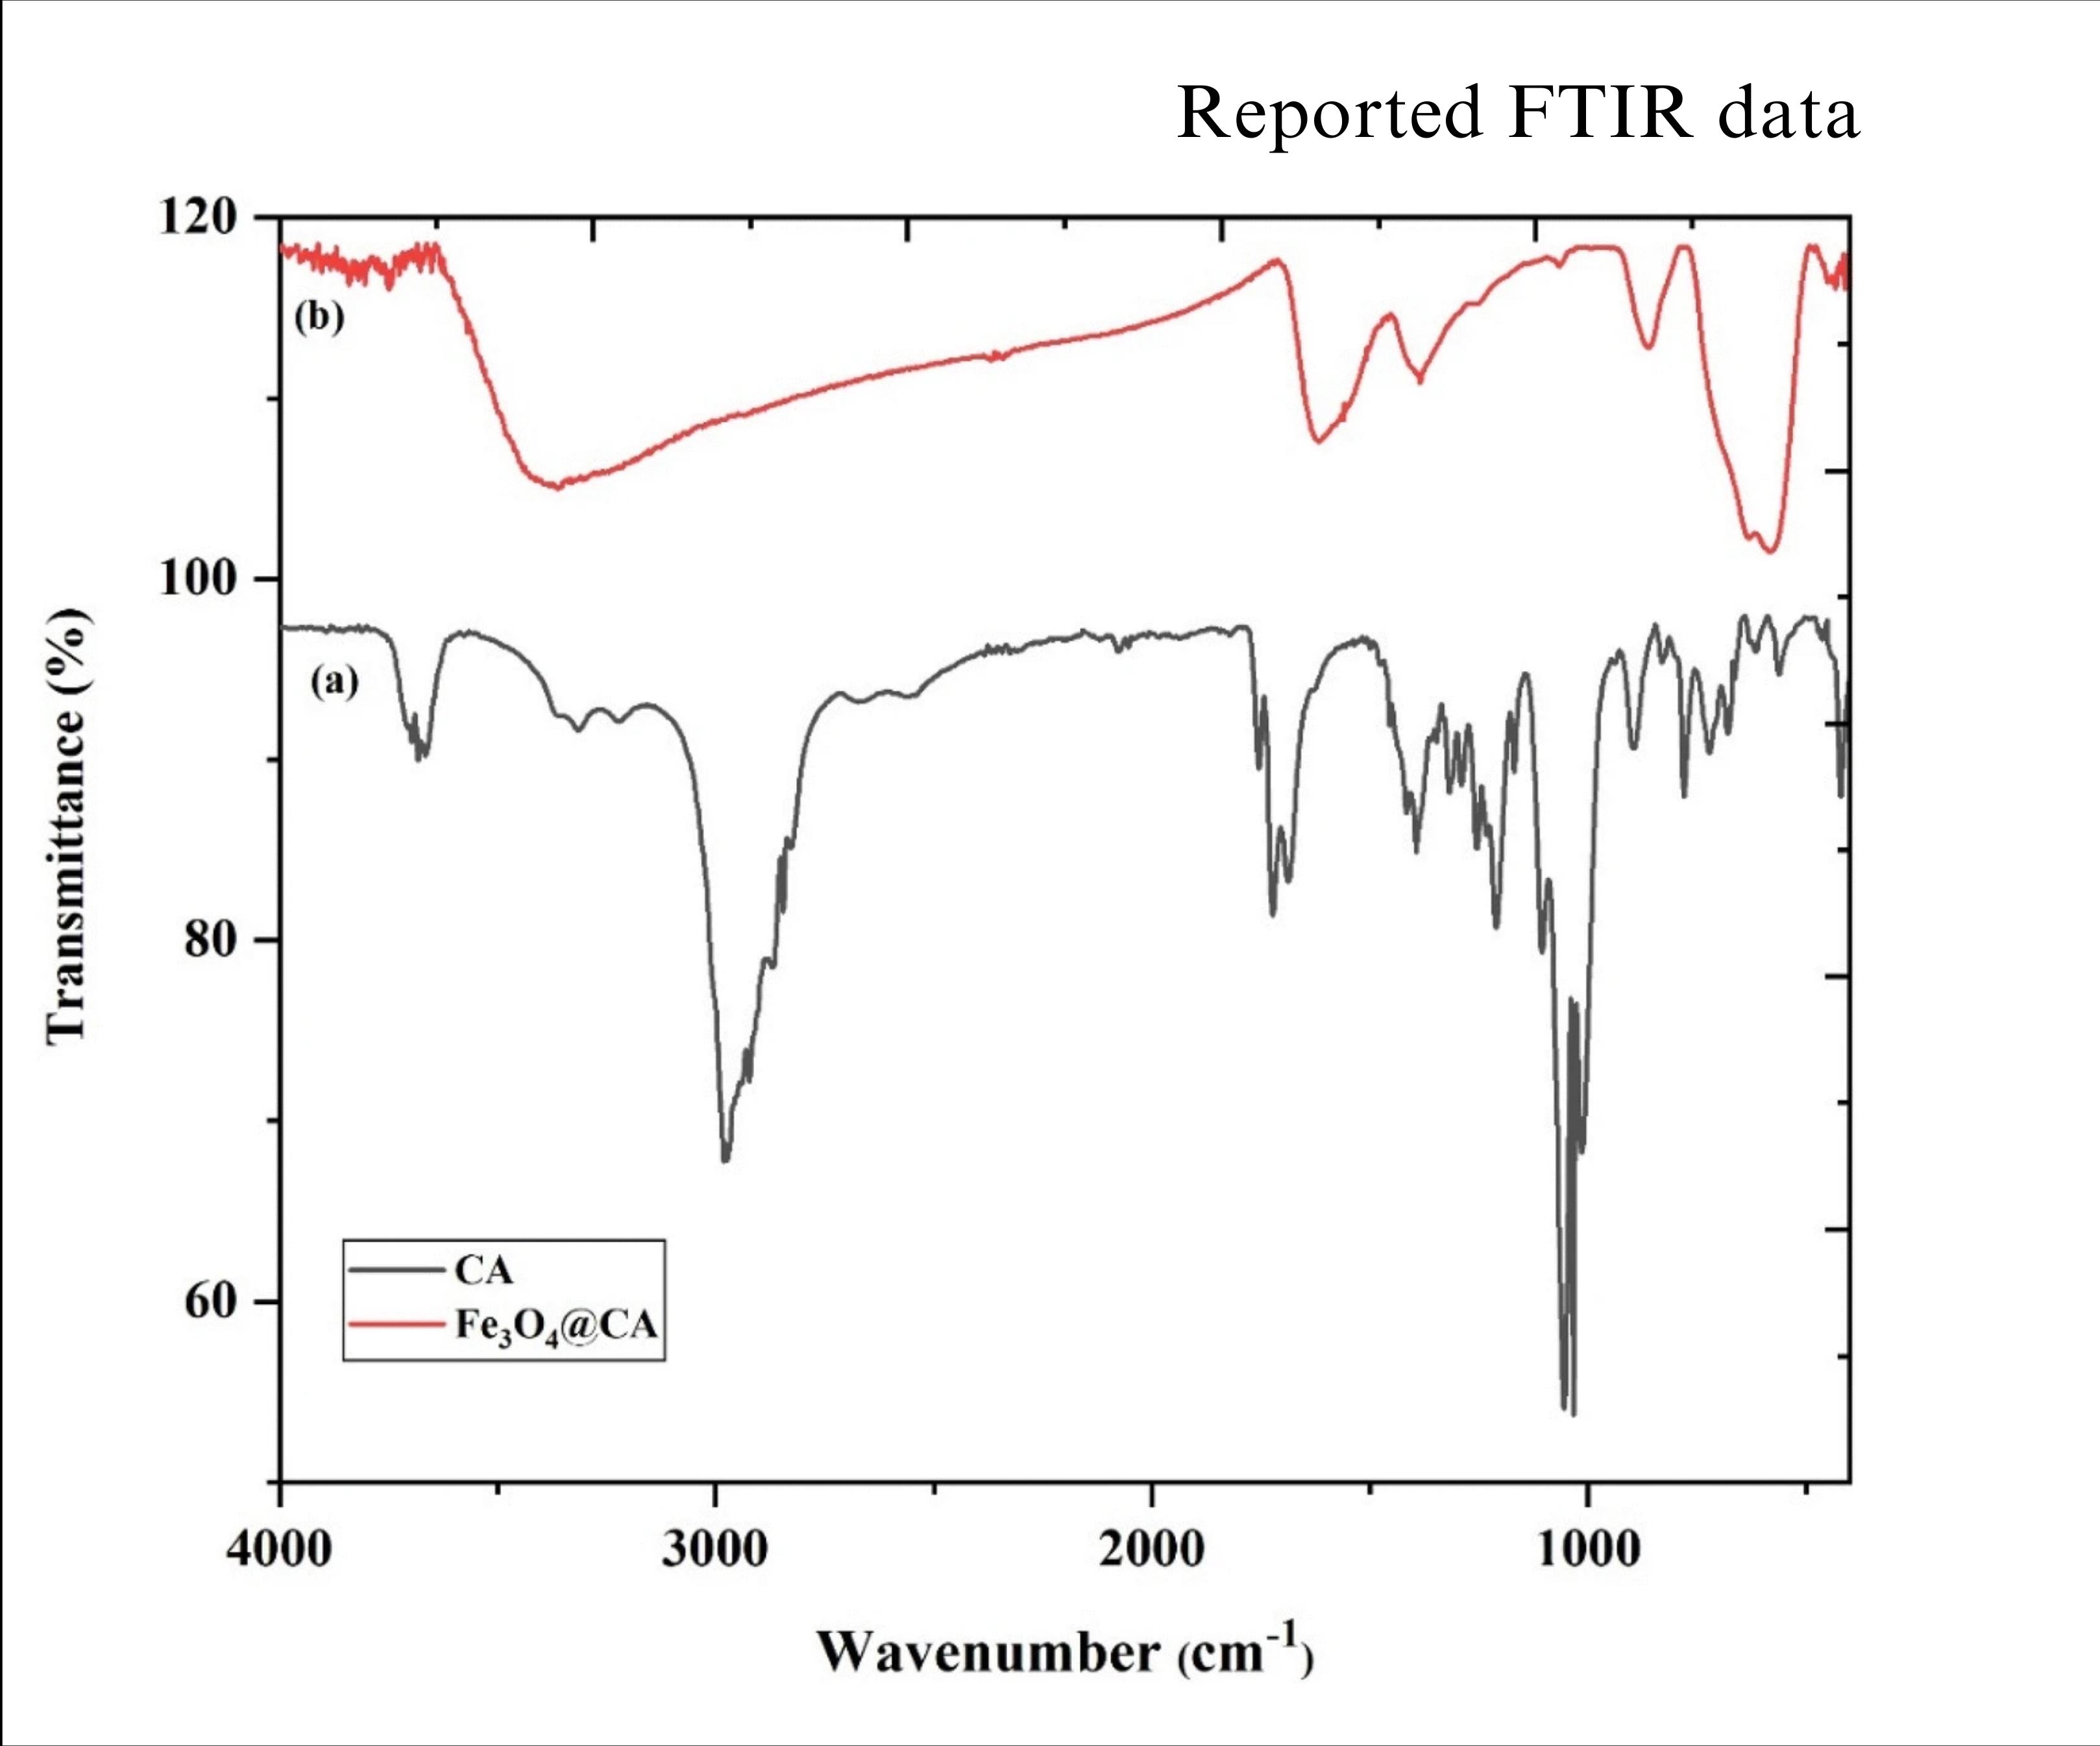
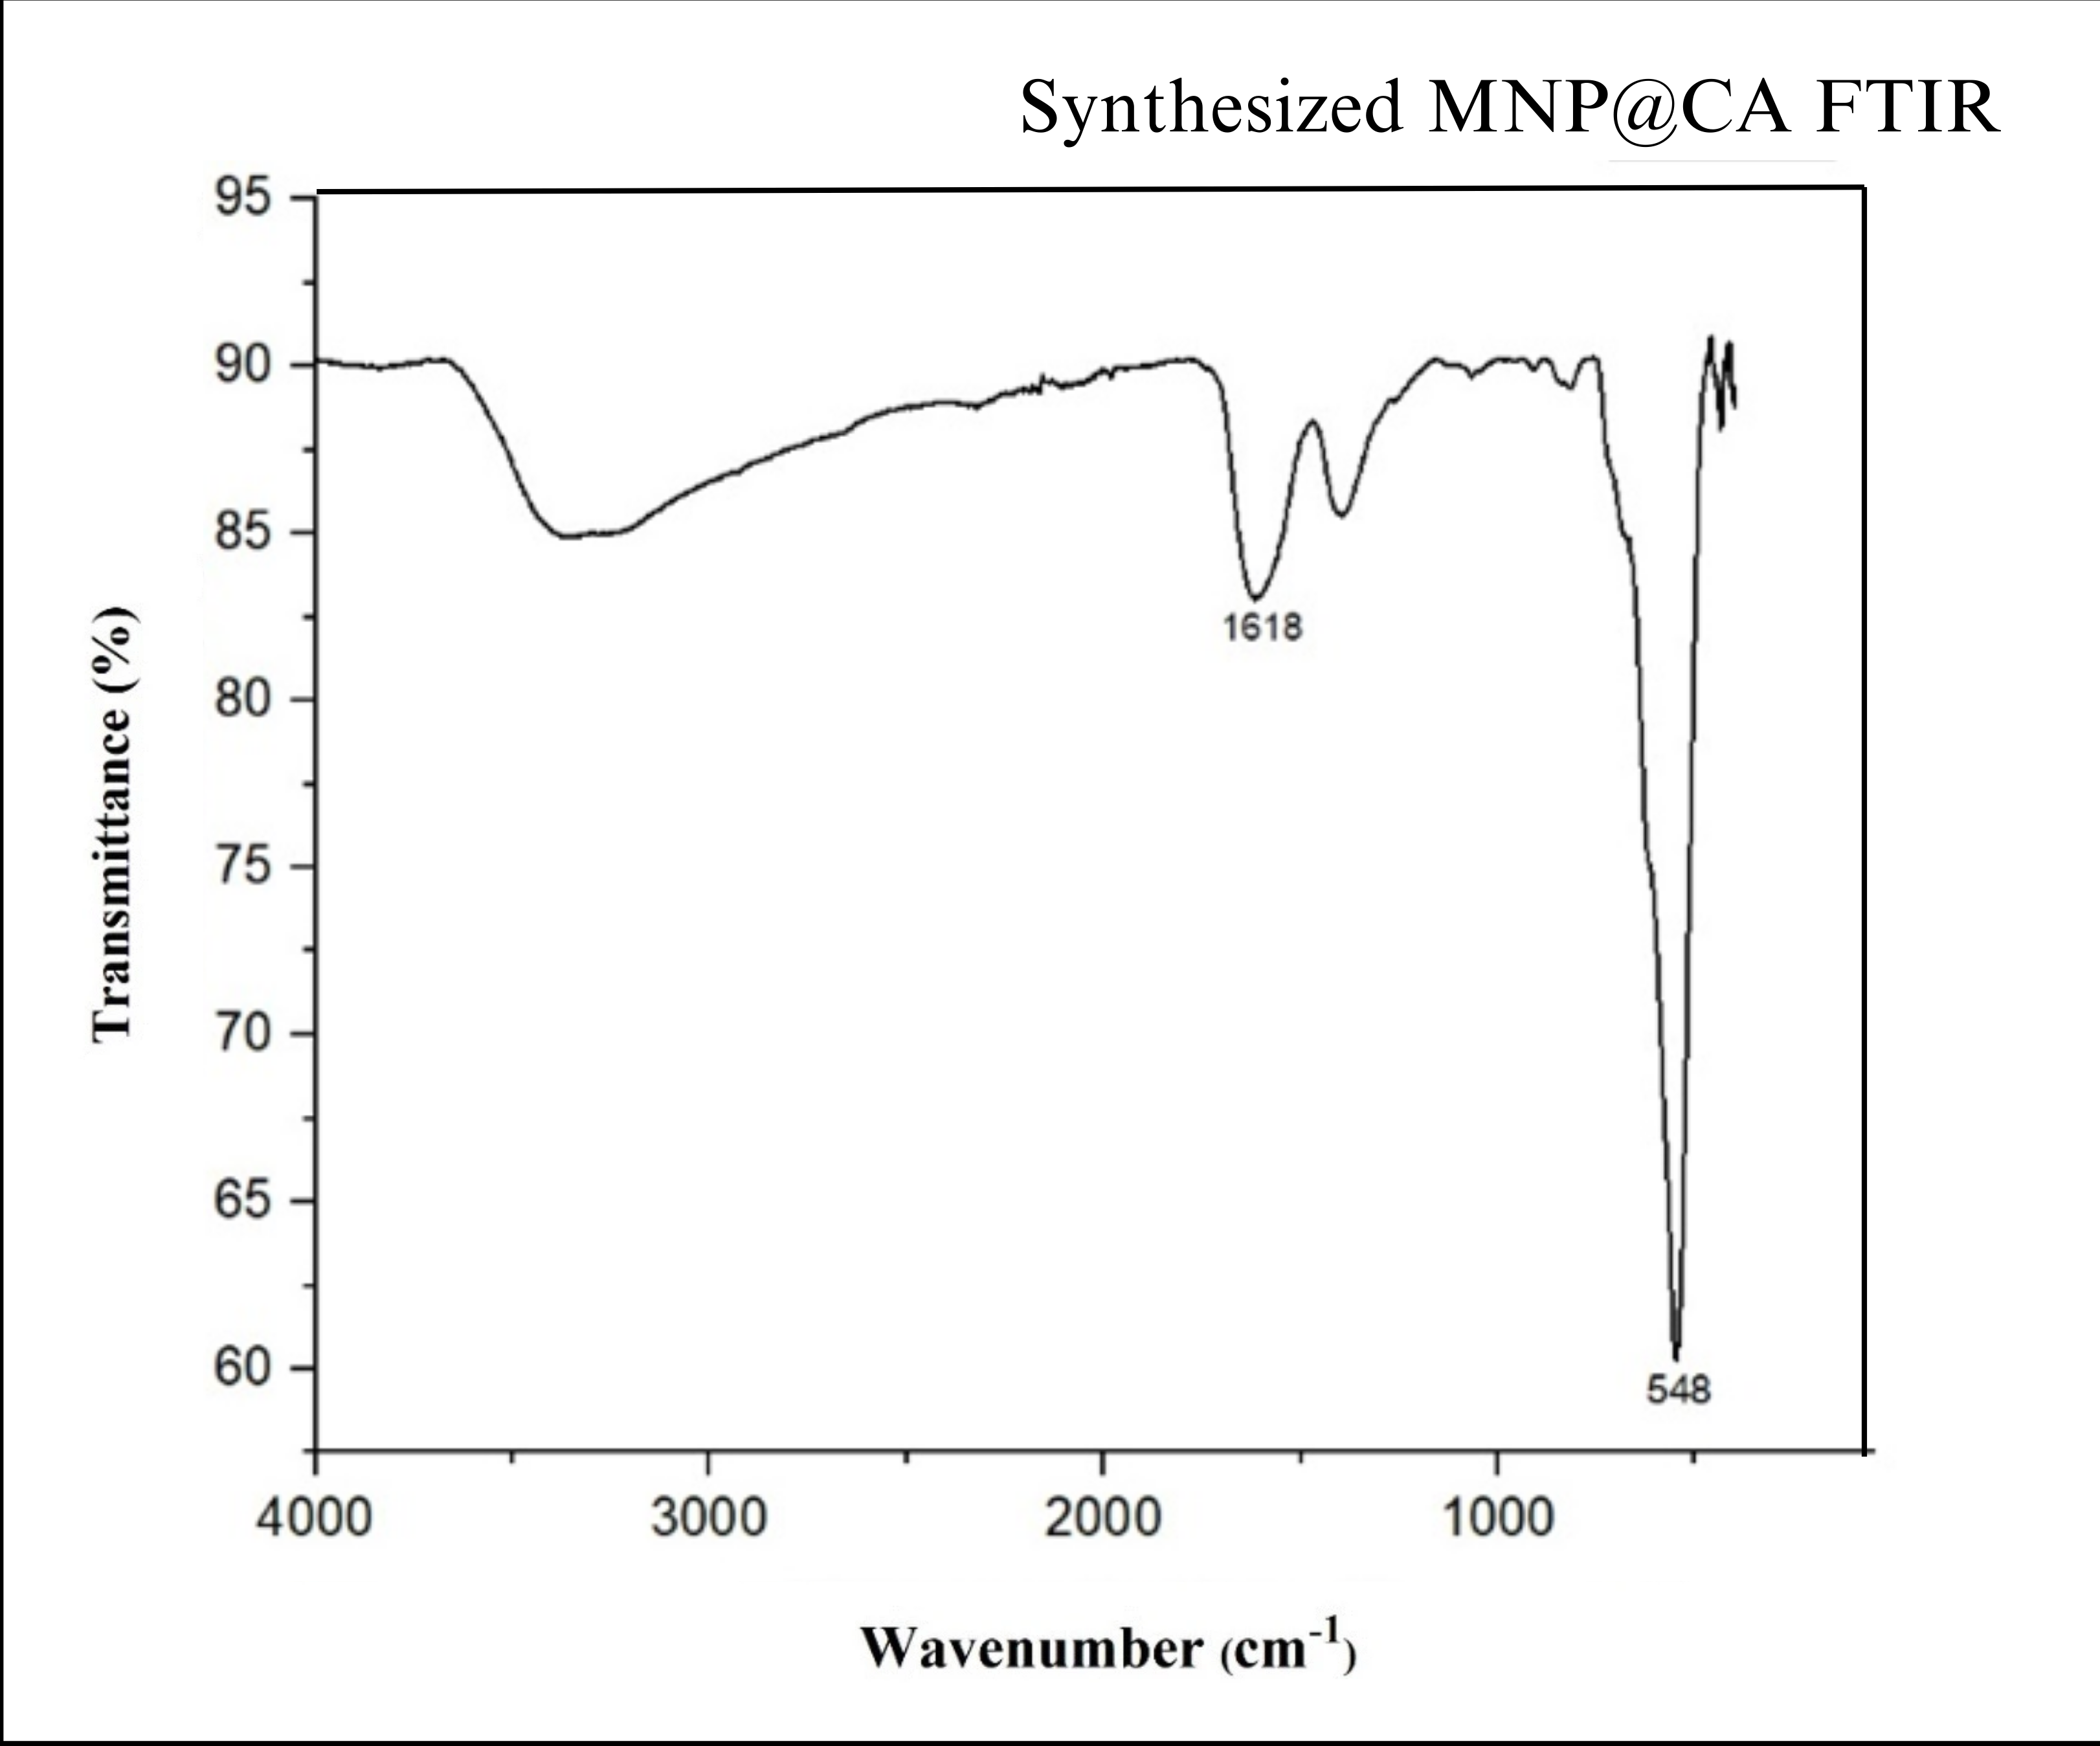
Fig 3.2: FT-IR graphs of carboxy functionalized magnetite nanoparticles: Standard (left) and experimentally obtained (right)
Fig 3.2: FT-IR graphs of carboxy functionalized magnetite nanoparticles: Standard (top) and experimentally obtained (bottom)
- Dynamic Light Scattering (DLS): DLS provided particle size distribution data, revealing monodispersed particles with an average diameter of 142.6 nm, suitable for enzyme immobilization.
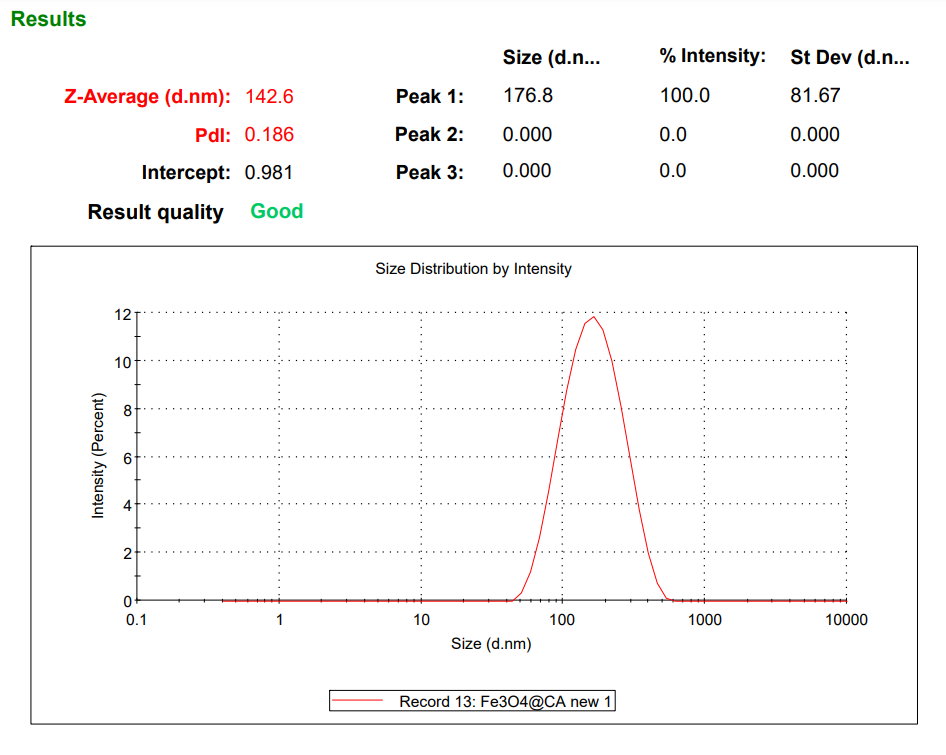
Fig 3.3: DLS – Malvern Zetasizer results of the synthesized MNPs
───── ⬢ ⬢ ⬢ Molecular Biology ⬢ ⬢ ⬢ ──────
Molecular Biology
4. Carbonic Anhydrase Enzyme Production:
a) Using Pichia pastoris:
The production of CA at an industrially relevant scale demands a host organism capable of producing high yields of functional enzymes. For this project, Pichia pastoris was selected as the expression system for several reasons:
- High Expression Levels: Pichia pastoris can achieve high yields of recombinant proteins, ideal for industrial applications where enzyme concentration is critical.
- Secretion of Protein Products: P. pastoris has the ability to secrete the recombinant protein into the culture medium, significantly simplifying downstream purification since the enzyme is present in the extracellular space rather than intracellularly.
- Post-Translational Modifications (PTMs): P. pastoris can perform eukaryotic-like PTMs, which are essential for the proper folding, stability, and activity of complex proteins such as CA.
- Scalability: Pichia pastoris can be grown to high cell densities in bioreactors, making it cost-effective for large-scale production.
i. Gene Identification and Primer Design:
The Carbonic Anhydrase (CA) gene was selected from Saccharomyces cerevisiae. As both are yeast species, P. pastoris can provide the necessary protein folding and post-translational modifications (PTMs) for the CA enzyme, preserving its biological activity. The NCE103 gene is readily available in yeast genome databases, and its amplification is straightforward, facilitating efficient cloning and expression. The gene sequence was used to design primers, incorporating EcoRI and XbaI restriction sites for insertion into the pGAPZα vector, adjusting the melting temperatures.
- Gene ID: NCE103
- Nucleotide Length: 663 bp
- Forward Primer: 5'-ATGAGCGCTACCGAATCTTC-3'
- Reverse Primer: 5'-CTATTTTGGGGTAACTTTTGTG-3'
ii. PCR Amplification of the CA Gene:
The CA gene was amplified from S. cerevisiae genomic DNA using PCR. The reaction setup and cycling conditions are detailed below.
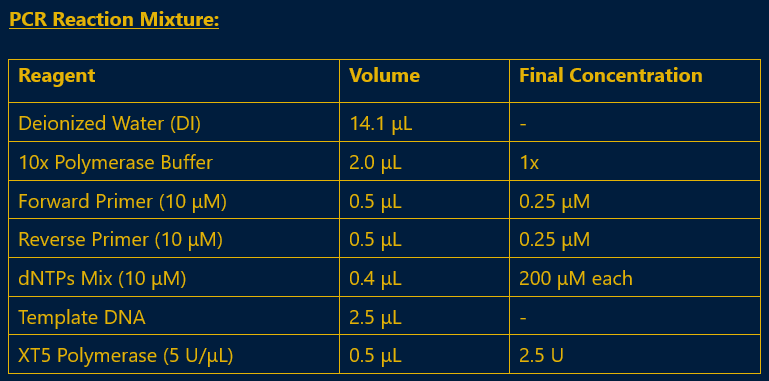
Fig 4.1: PCR Master Mix for Insert Gene Amplification
PCR Cycling Conditions:
- Initial Denaturation: 94°C for 3 minutes
-
Cycles (25x):
- i. Denaturation: 94°C for 30 seconds
- ii. Annealing: 55°C for 30 seconds
- iii. Extension: 72°C for 1 minute
- Final Extension: 72°C for 10 minutes
Results:
The amplified DNA was separated using agarose gel electrophoresis (AGE). The bands were visualized using ethidium bromide staining and a Versa-Doc system. The target band, corresponding to the 663 bp size of the NCE103 gene, was excised and extracted from the gel using a DNA purification kit.
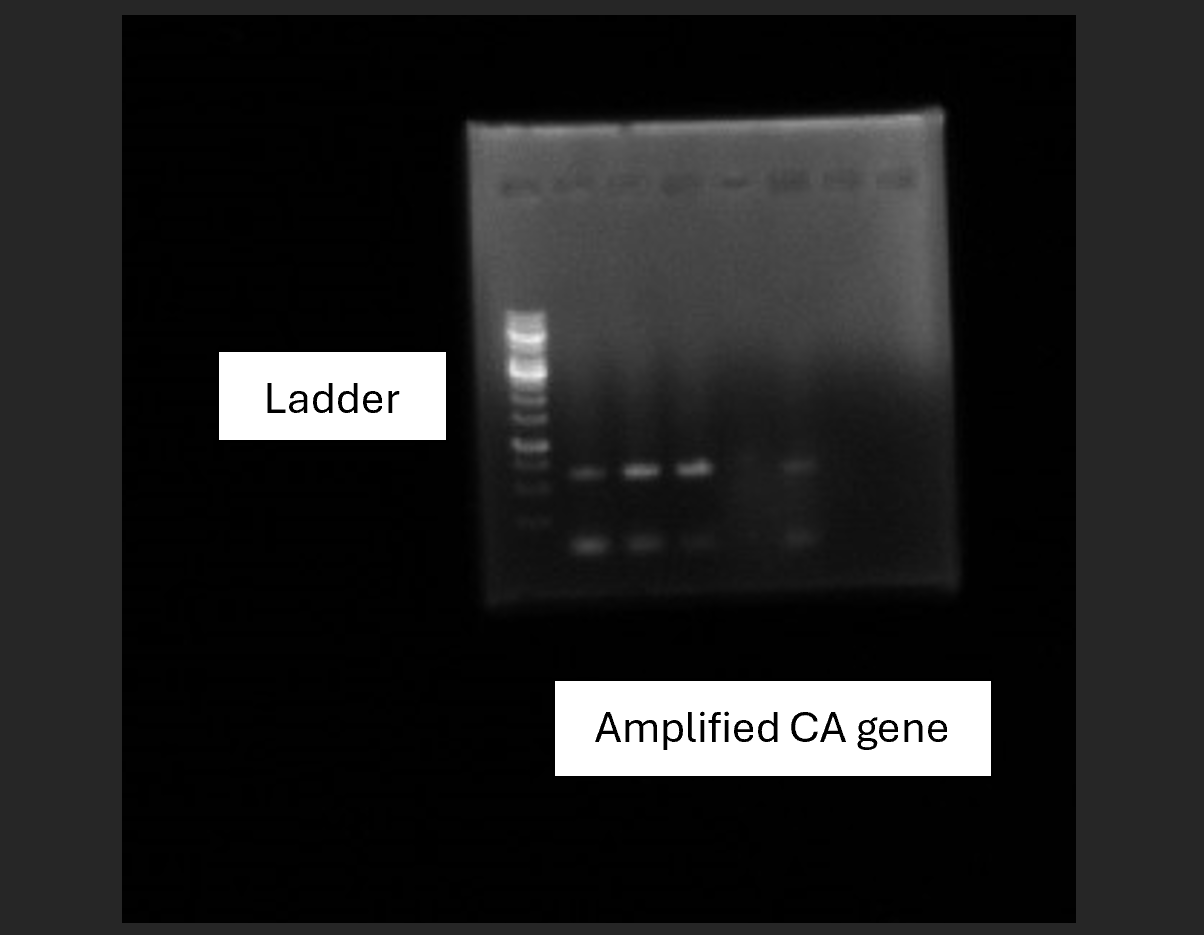
Fig 4.2: AGE of amplified DNA: From left to right – 1KB Ladder, Amplified DNA
iii. Plasmid Preparation and Restriction Digestion:
For efficient expression of the CA gene in Pichia pastoris, the pGAPZα vector was chosen. The pGAPZα vector originally contained a Zeocin™ resistance gene for selection in both E. coli and Pichia pastoris. However, Zeocin™ is an expensive antibiotic, which can increase overall production costs. To improve cost efficiency, the Zeocin™ resistance gene was replaced with the KanMX gene, which provides resistance to kanamycin in E. coli and G418 in Pichia pastoris. This modification allows for economical selection using kanamycin and G418, which are more cost-effective than Zeocin™.
- i. Plasmid DNA was isolated from E. coli Dh3α using the standard plasmid preparation protocol.
- ii. Restriction digestion was performed using EcoRI and XbaI, which recognize specific sequences on the plasmid. EcoRI cuts at GAATTC, while XbaI cuts at TCTAGA, both located at convenient positions in the pGAPZα plasmid for inserting the CA gene.
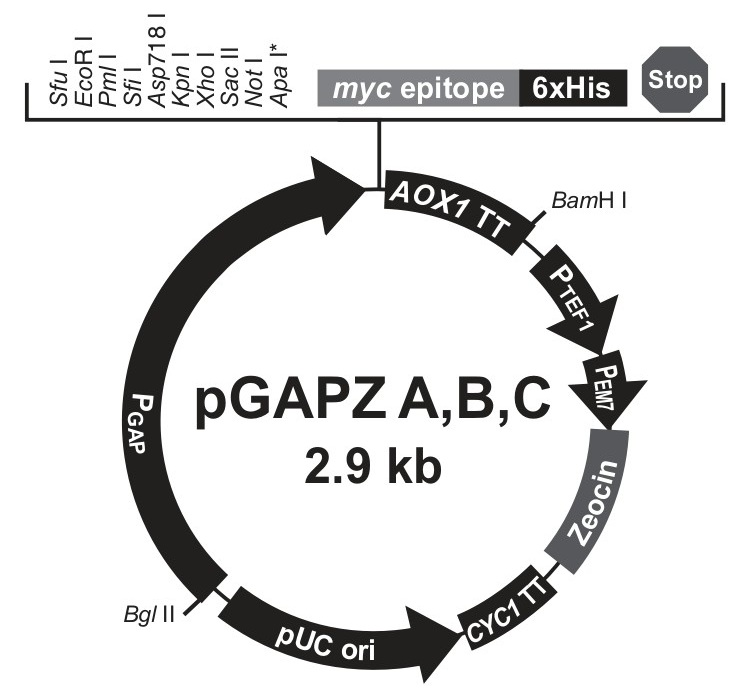
Fig 4.3: Plasmid Map of pGAPZα with Zeocin™ resistance gene (from Thermo-Fischer Scientific)
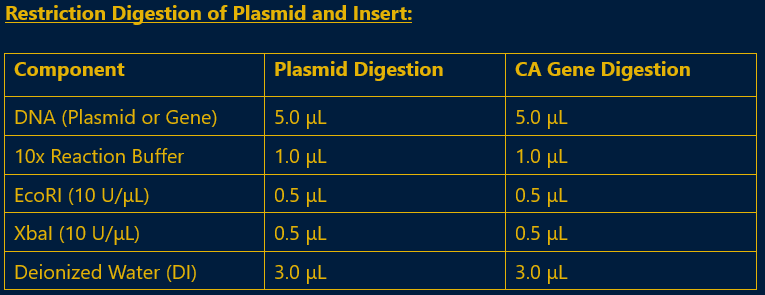
Fig 4.4: Reaction Mix for Restriction Digestion of Plasmid and Insert
- iii. Incubation: The required digestion time needed optimization to prevent overdigestion. The plasmid was digested for 9 minutes, and the CA gene was digested for 30 minutes at 37°C.
- iv. Verification: These digestions were followed by agarose gel electrophoresis to verify the presence of the correct band patterns. A 1 kb ladder was used for size reference, and a plasmid control without enzyme digestion was also run for comparison.
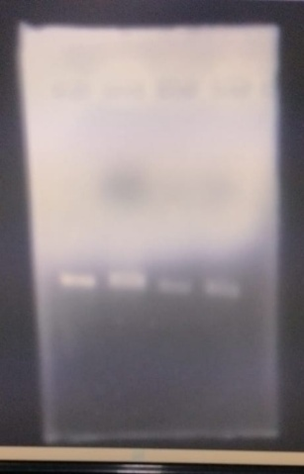
Fig 4.5: AGE of Digested Insert: from left to right - 1 KB ladder, insert digestion post 30mins, 40 mins, 50 mins
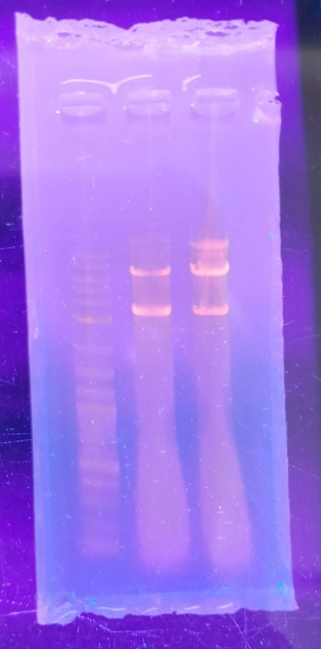
Fig 4.6: AGE of Digested Plasmid: from left to right - 1 KB ladder, Plasmid digestion post 9 mins, 15 mins
iv. Ligation of the CA Gene into pGAPZα Vector:
- i. Following the validation of digestion, the digested plasmid and CA gene were ligated using T4 DNA ligase, facilitating the insertion of the gene into the plasmid for further transformation steps.
- ii. Incubation: The ligation reaction was incubated at 20°C overnight.
v. Transformation of E. coli and Colony PCR:
The ligated plasmid was introduced into competent E. coli Dh3α cells by heat shock transformation. The procedure was conducted as follows:
-
i. Preparation of Competent Cells:
- E. coli Dh3α was grown overnight in LB medium.
- The culture was harvested and washed with cold 0.1 M CaCl₂ solution.
-
ii. Heat Shock Transformation:
- 100 μL of competent cells were mixed with 10 μL of the ligation reaction.
- The mixture was incubated on ice for 30 minutes.
- The cells were heat shocked at 42°C for 45 seconds, followed by incubation on ice for 2 minutes.
- 900 μL of SOC medium was added, and the cells were allowed to recover at 37°C for 1 hour.
- The transformed cells were plated on LB agar containing kanamycin for selection.
- iii. Colony PCR was performed to confirm the presence of the CA gene in the transformed colonies.
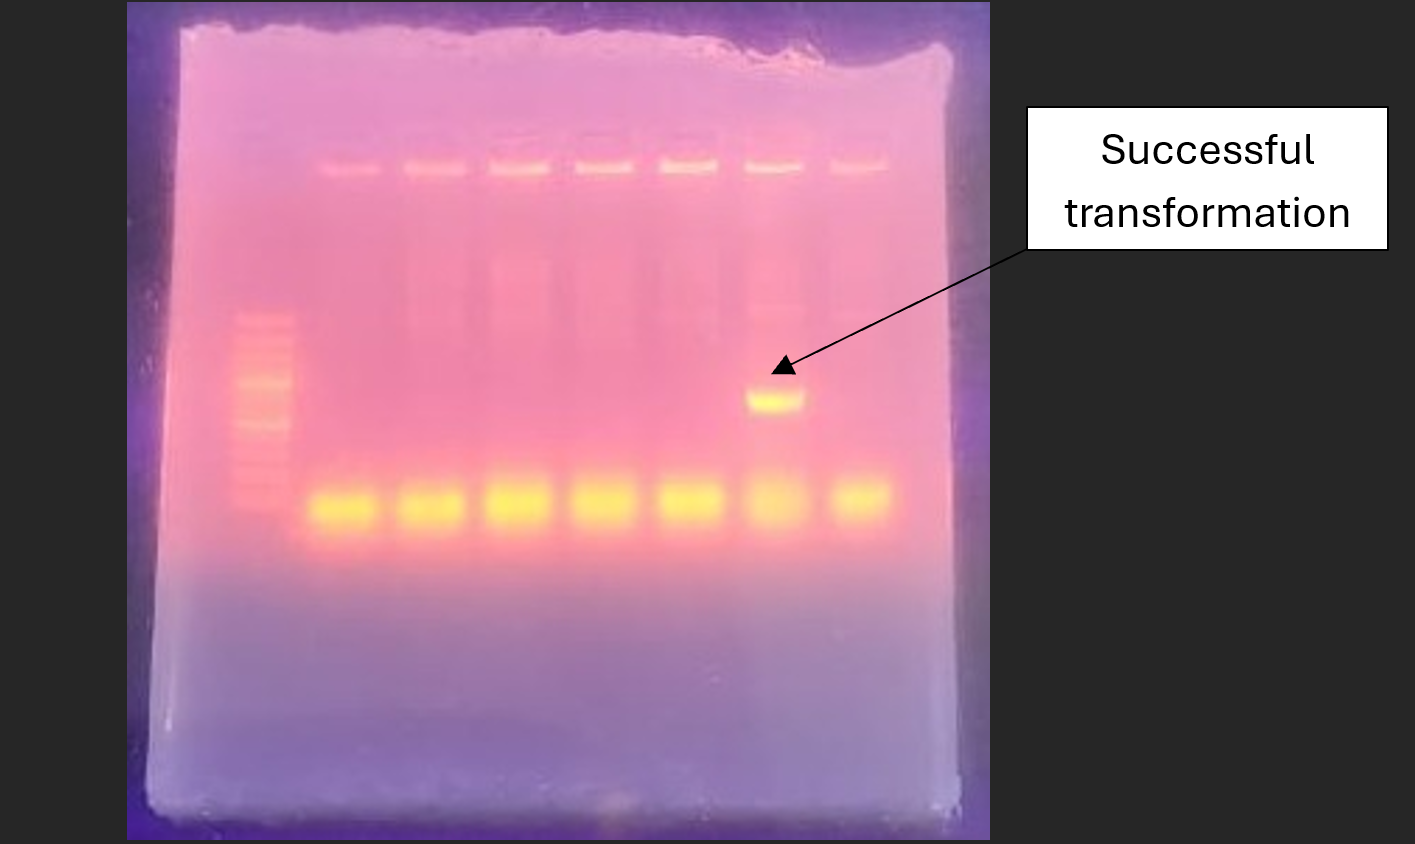
Fig 4.7: AGE of Colony PCR: from left to right – 1 KB ladder, PCR of individual colony; 6th colony showing successful transformant
vi. Plasmid Preparation from Transformed E. coli and Linearization:
- i. After transforming the ligated plasmid into E. coli, we prepared the plasmid from the culture using a standard plasmid preparation protocol.
- ii. The prepared plasmid was linearized using BsphI, ensuring it was ready for integration into the Pichia pastoris genome.
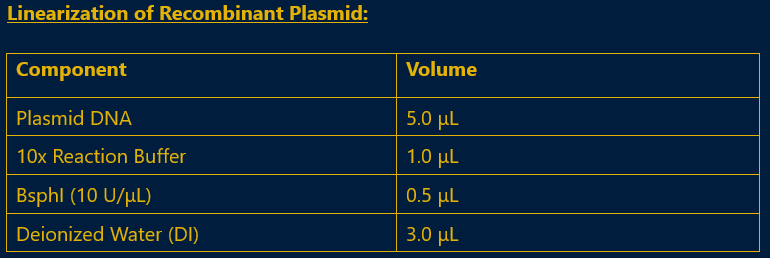
Fig 4.8: Reaction Mix for Recombinant Plasmid Linearization
- iii. Incubation: The reaction was incubated at 37°C for 3 to 4 hours.
vii. Transformation into Pichia pastoris:
The linearized plasmid was introduced into Pichia pastoris following the standard transformation protocol. The steps included preparation of competent cells using 1 M LiCl, PEG treatment, and the addition of carrier DNA.
Transformation Procedure:
- 1. 100 μL of competent cells were prepared using LiCl treatment.
- 2. 50 μL of the digested plasmid was mixed with 5 μL of boiled salmon sperm DNA (used as carrier DNA).
- 3. The mixture was incubated at 30°C for 30 minutes.
- 4. Cells were then subjected to a heat shock and plated on YPD + G418 plates to select for successful integrants.
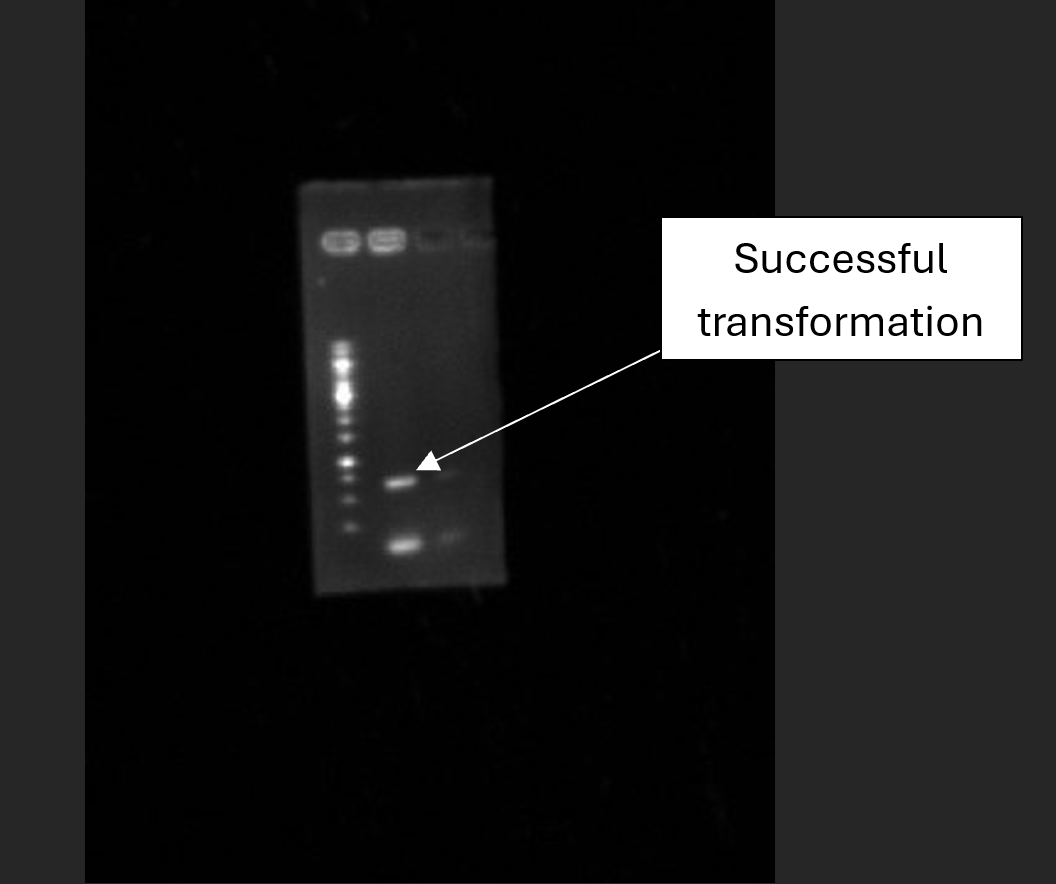
Fig 4.9: AGE of Colony PCR: from left to right – 1 KB ladder, PCR of successful transformant colony
viii. Expression, and Analysis of CA:
The CA gene was expressed in Pichia pastoris, and enzyme activity was assessed:
- The enzyme activity was assessed using the electrometric method developed by Wilbur and Anderson (1948). In a glass vial, 6 mL of 20 mM Tris Base buffer (pH 8.3, 25°C) was added, followed by 100 µL of the enzyme solution. A pH electrode was placed in the solution while stirring.
- To 6 ml of tris-HCL buffer (pH 8.3), 4 mL of ice-cold CO₂-saturated water was added. The drop in pH from 8.3 to 6.3 was monitored, and the time taken for this 2-unit pH drop was recorded. Chilled distilled water was used in place of the enzyme solution for control.

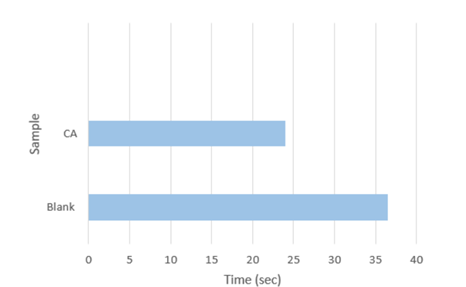
Fig 4.10: Wilbur Anderson Assay of obtained enzyme showing the amount of time taken for the pH to drop from 8.3 to 6.3
b) Using Spinach:
Background:
In addition to microbial expression systems, natural sources of carbonic anhydrase, such as spinach, provide a convenient and alternative means of obtaining CA. While this method is less scalable than recombinant expression, it offers a simpler approach for laboratory-scale applications of CA activity in CO₂ conversion processes.
Material and Methods:
-
i. Materials -
- Fresh spinach leaves
- Cold 20 mM Tris-HCl buffer (pH 8.0)
- Ammonium sulfate for protein precipitation
- Dialysis tubing (12 kDa)
-
ii. Procedure -
-
Enzyme Extraction:
- i. The stored spinach leaves were blended with cold 20 mM Tris-HCl buffer (pH 8.0) using a blender, applying approximately 1.5 mL of buffer per gram of leaves.
- ii. The resulting suspension was filtered through cheesecloth to remove debris.
- iii. The filtered homogenate was centrifuged at 4000 rpm for 30 minutes at 4°C to obtain a clear supernatant containing soluble proteins, including CA.
-
Ammonium Sulfate Precipitation:
- i. Ammonium sulfate was added to the supernatant to achieve 30% saturation, stirring for 1 hour at 0-4°C, followed by centrifugation at 4000 rpm for 30 minutes at 4°C to collect the precipitate.
- ii. More ammonium sulfate was added to bring the supernatant to 55% saturation, mixed for 1 hour at 0-4°C, and centrifuged again at 4000 rpm for 30 minutes at 4°C.
- iii. The precipitate was recovered and resuspended in a minimal volume of 20 mM Tris-HCl buffer (pH 8.0).
-
Dialysis:
- i. The resuspended protein solution was dialyzed against 20 mM Tris-HCl buffer (pH 8.0) at 0-4°C for 24 hours to remove excess ammonium sulfate.
-
Enzyme Extraction:
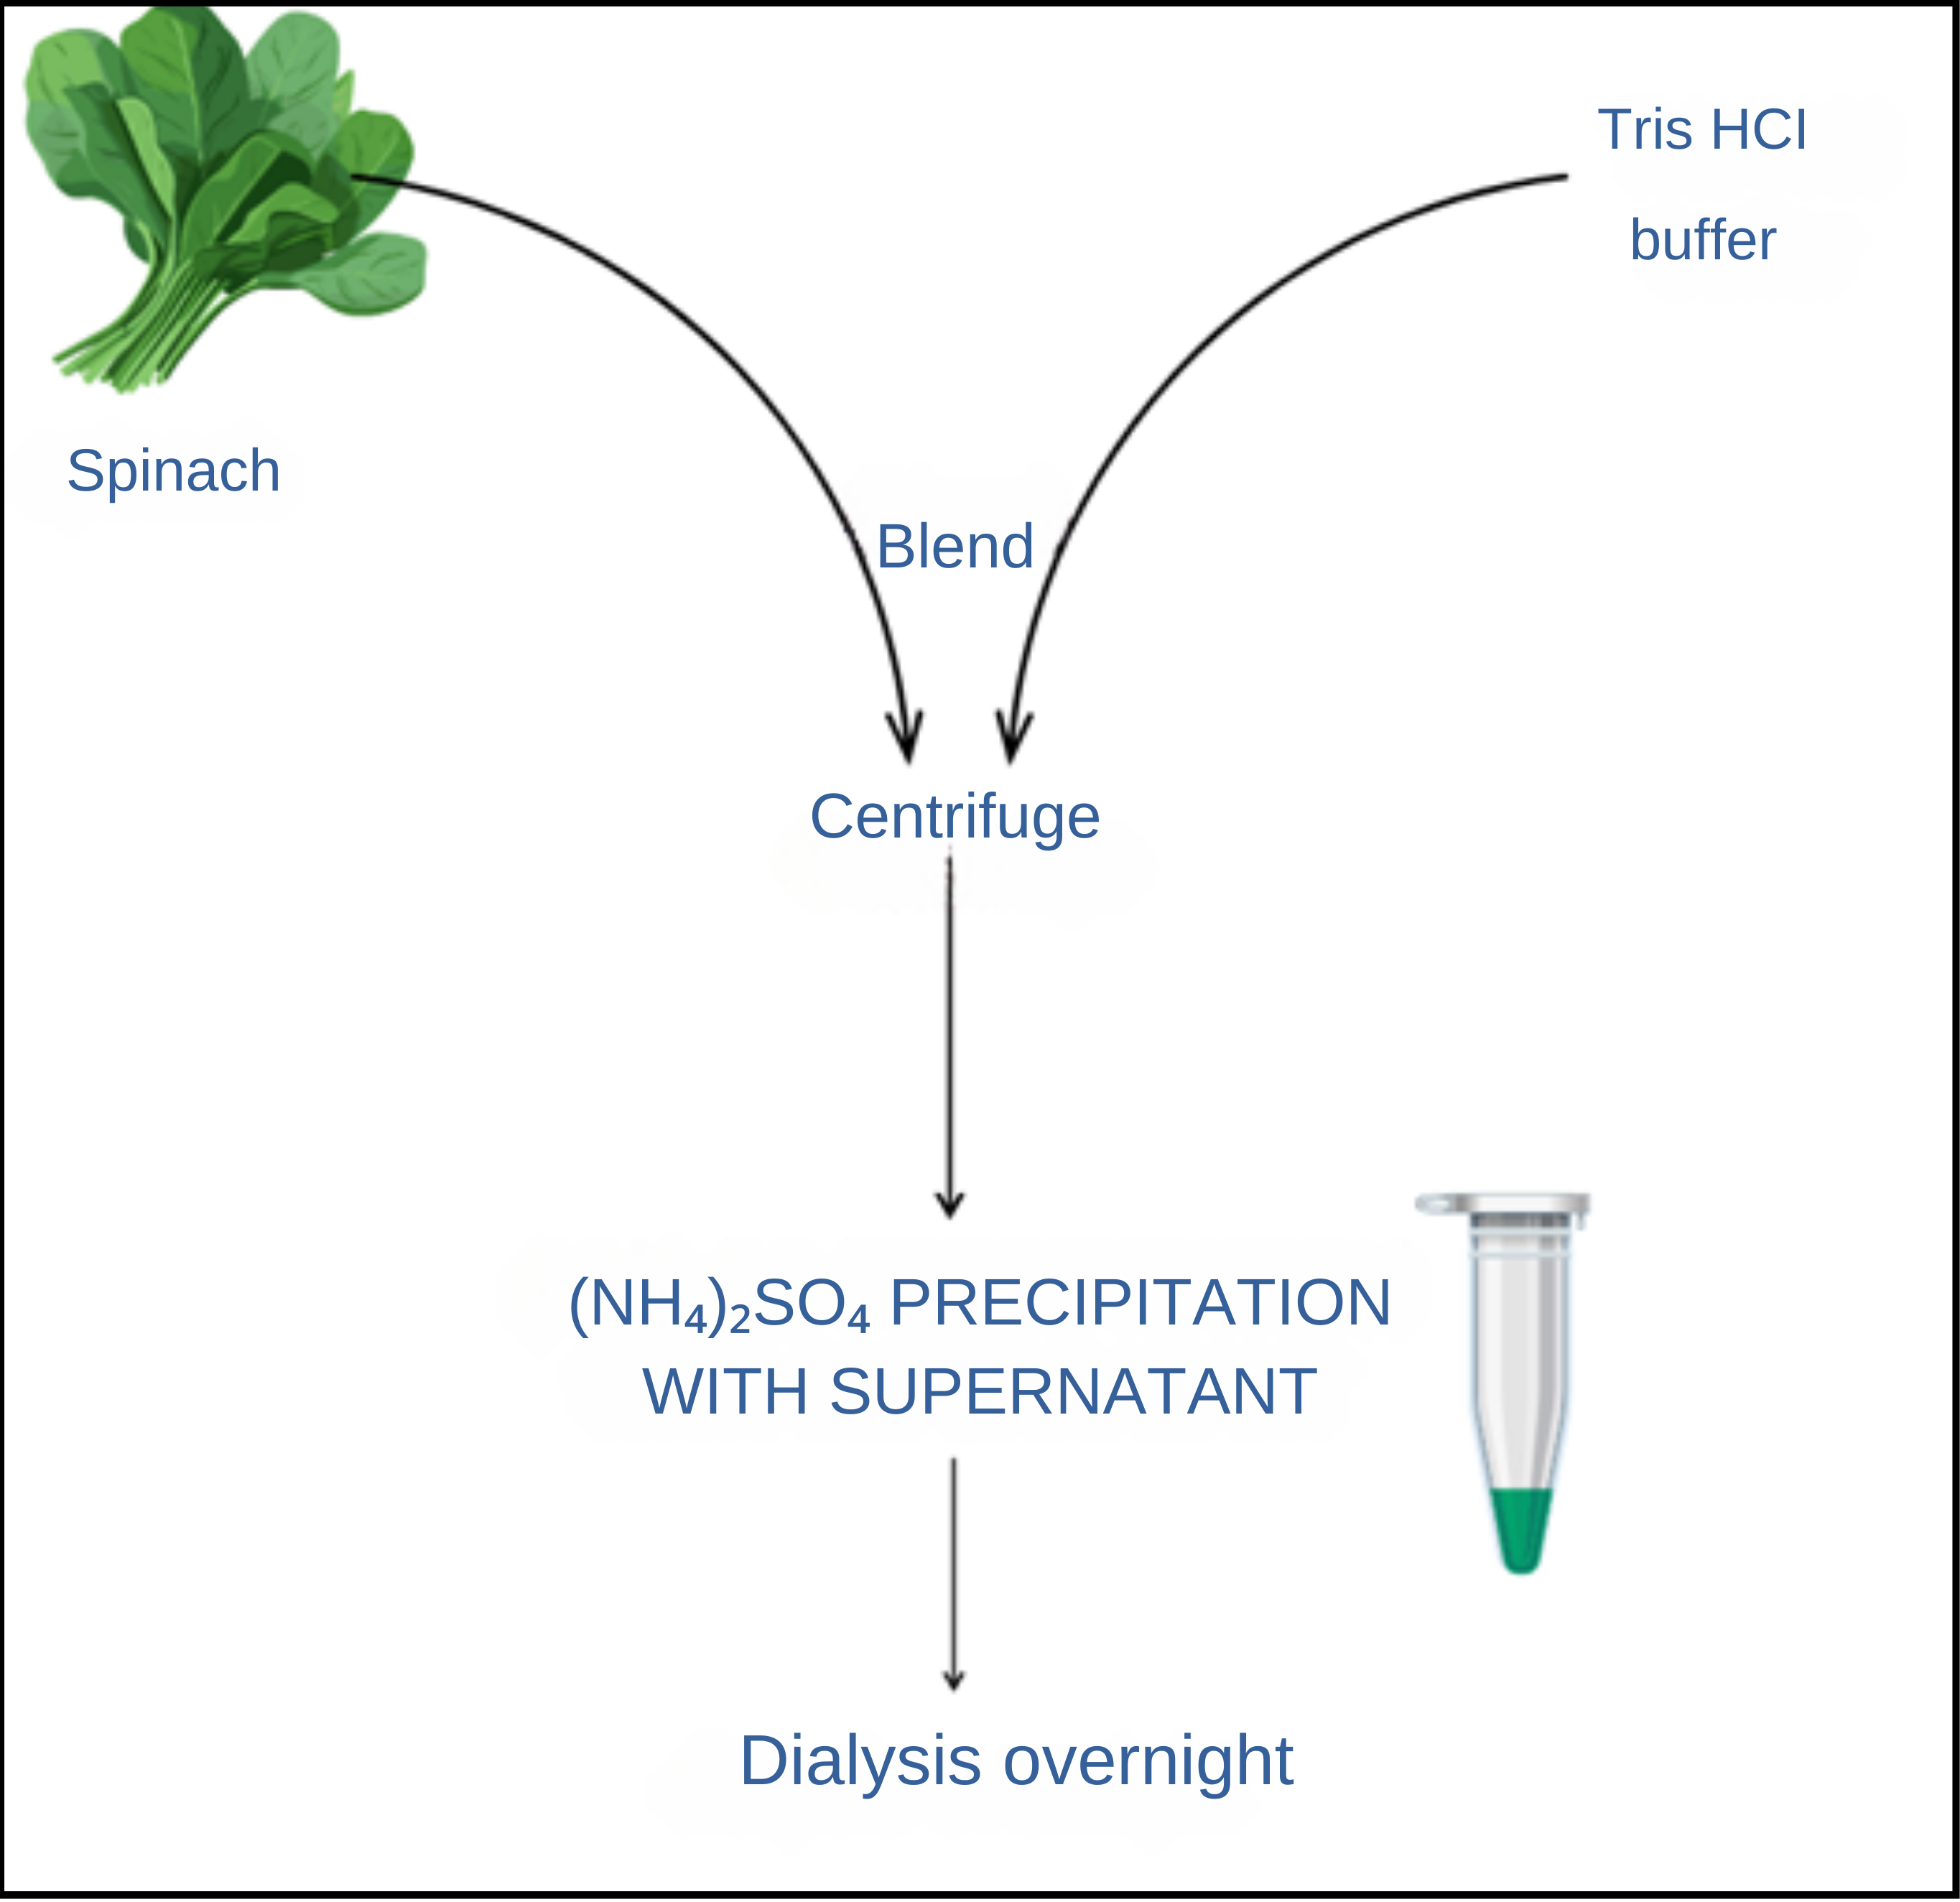
Fig 4.11: Extraction Process of CA from Spinach
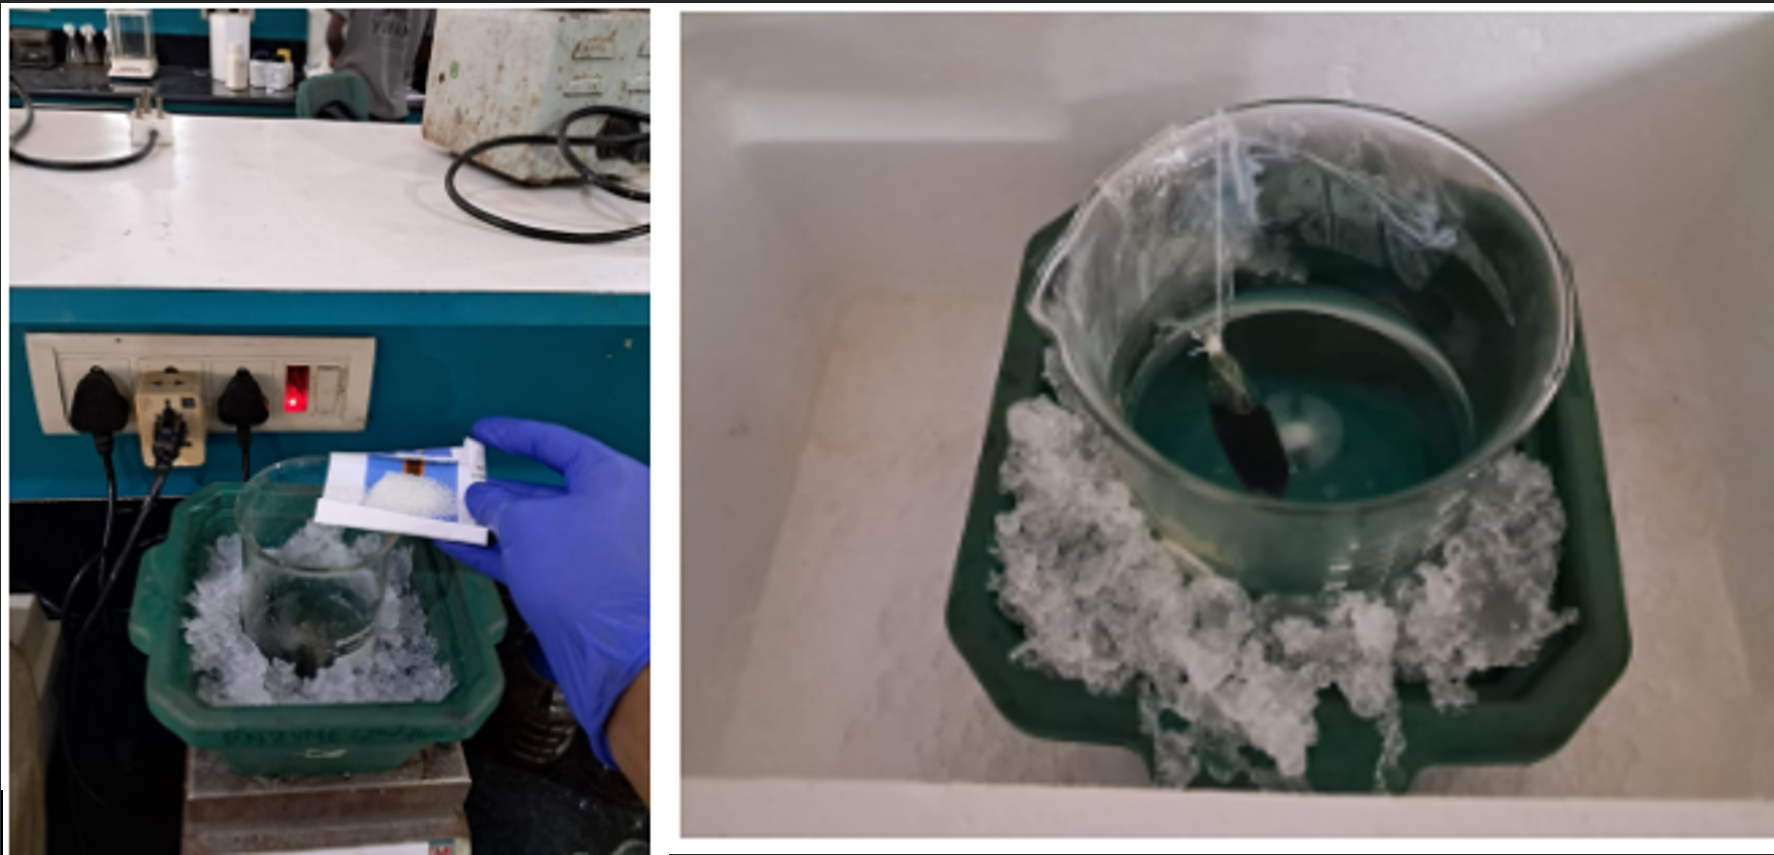
Fig 4.12: CA Enzyme Extraction done at ICT Mumbai
iii. Enzyme Activity Assay:
The enzyme activity was assessed using the Wilbur-Anderson Method as mentioned above for analysis of CA overexpressed by Pichia pastoris
Assay for CA from Dialysed Spinach Extract
The enzyme activity extracted from spinach was assessed using the Wilbur Anderson electrometric method as explained above.

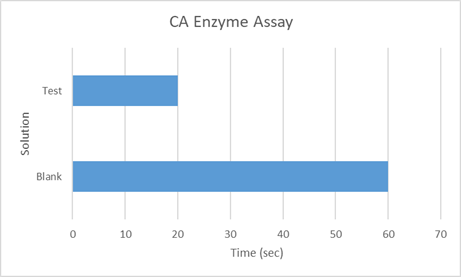
Fig 4.13: Wilbur Anderson Assay for CA from Dialysed Spinach Extract
c) Comparison of Methods of Enzyme Production:
i. Scalability of the Process:
- Extraction from Spinach: The process described above extracts CA from spinach leaves using a partial purification method that includes ammonium sulphate precipitation and dialysis. This plant-based extraction method has potential scalability, but it could face challenges in achieving large-scale production consistently, as plant-based materials may vary in enzyme concentration based on growing conditions. Scaling up would also require substantial processing of plant material and a stable supply chain for fresh spinach leaves.
- Extraction with Pichia pastoris: The process described above is a molecular biology-based method where the CA gene was identified, cloned, and expressed in Pichia pastoris, a yeast species. This gene-based method has high scalability potential, as yeast cultures can be maintained in controlled fermentation systems with less variability than plant extraction. This approach is more compatible with industrial-scale enzyme production, allowing for precise control over enzyme yields and quality.
ii. Cost and Economics of Both Processes, Chemicals, and Equipment:
- Extraction from Spinach: The plant extraction method involves centrifugation, blending, ammonium sulphate precipitation, and dialysis. It uses reagents like ammonium sulphate, buffers etc. The cost here includes labour for plant handling, enzyme extraction, and reagents for partial purification. However, the method might be cost-effective in regions with abundant spinach but may require ongoing costs to source fresh plant materials and manage batch-to-batch variability in enzyme yield.
- Extraction with Pichia pastoris: The molecular biology approach uses PCR, restriction enzymes, plasmids, and specific growth media for Escherichia coli and Pichia pastoris. The cost structure here includes expenses related to genetic manipulation, growth media, and bioreactors of variable sizes for fermentation. Although initial setup costs for genetic engineering and fermentation infrastructure are higher, the long-term production costs may be lower due to reduced dependency on raw plant materials. Additionally, once the recombinant system is established, it can be reused, reducing the need for ongoing reagent costs associated with plant extraction.
iii. Activity of Enzyme Expected:
- Extraction from Spinach: The activity of the CA enzyme extracted from spinach leaves was measured under various conditions, showing that immobilized CA had higher stability and recyclability than the free enzyme.Due to the nature of plant-based extraction, the enzyme activity might vary based on the plant source and purification efficiency.
- Extraction with Pichia pastoris: In this method, the CA enzyme produced in Pichia pastoris was confirmed to be active through pH change assay, suggesting consistency in enzyme production. However, immobilization of this CA enzyme on nanoparticles was not possible due to its lower half life. We expect the enzyme activity to be reliable and reproducible, ideal for industrial applications that demand high efficiency and predictable activity for CO₂ sequestration since Pichia pastoris is engineered for consistent expression.
iv. Conclusion:
In summary, the gene-based approach from the extraction with Pichia pastoris offers higher scalability, potentially lower long-term costs, and more consistent enzyme activity compared to the extraction from spinach method. The plant-based method might be more feasible in smaller-scale or resource-constrained environments, but for large-scale, consistent production, the molecular biology approach is more advantageous.
5. Immobilization of enzyme:
Background:
Immobilization of enzymes is a process that involves attaching or confining enzymes to a solid support, which can improve their stability, reusability, and control over reaction conditions. This technique has significant applications in various industries, including food production, pharmaceuticals, and biotechnology. Traditional enzyme use in solution often presents challenges, such as difficulty in separation and enzyme inactivation over time. Immobilization helps overcome these issues by stabilizing enzymes, making them reusable and extending their operational lifetime. There are various methods of immobilization, including adsorption, covalent bonding, entrapment, and encapsulation. Each method has its advantages and is selected based on the enzyme’s characteristics and the intended application. Immobilized enzymes are widely used in bioreactors and biosensors, highlighting the industrial importance of this technique.
Material and Methods:
Materials: Carboxyl-functionalized MNPs, CA enzyme.
Procedure
- i. Immobilization of CA: CA was added to the activated MNP solution and incubated at 0-4°C for 5 hours while being agitated to allow binding.
- ii. Washing and Separation: The MNP-CA complexes were washed to remove unbound enzyme.
Results:
The activity of CA enzyme post-immobilization was assessed using the same assay method as discussed above. 10 ml of the CA-containing fraction was immobilized on 75 mg MNPs by incubating at 0°C for 6 hours.

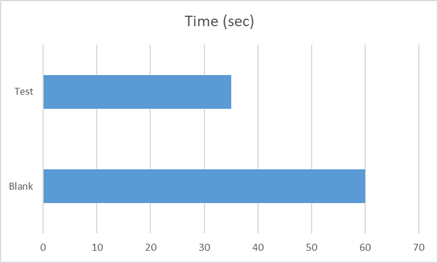
Fig 5.1: Wilbur Anderson Assay for CA immobilized MNPs
Each mL of the suspension contained 75mg of MNPs. Therefore, it was determined that 190.47 units of CA activity was present per gm of MNPs
6. Growth Curve Analysis:
Background:
To evaluate the effect of carbonic anhydrase (CA) on CO₂ capture, we monitored growth curves of E. coli cultured in a minimal medium with glucose, comparing a Control group with no CA and a test group containing CA-immobilized magnetite nanoparticles (CA-MNPs). The immobilized CA facilitates the conversion of CO₂ to bicarbonate, enhancing the availability of CO₂ for cellular assimilation.
Material and Methods:
-
1. Culture Conditions:
- i. Organism: Escherichia coli
- ii. Medium: Minimal medium supplemented with glucose as the carbon source.
- iii. Setup: Cultures were aerated continuously with sterile air to maintain a consistent CO₂ supply.
-
iv. Groups:
- Control: E. coli with only magnetic nanoparticles.
- CA-MNP: E. coli with CA-immobilized MNPs, with CA activity at 120 WA units/g (as determined in prior experiments)
-
2. Growth Curve Monitoring:
- i. Method: Optical density at 600 nm (OD₆₀₀) was measured up to 24 hours.
- ii. Replicates: Each group was conducted in triplicate to ensure the reliability of results.
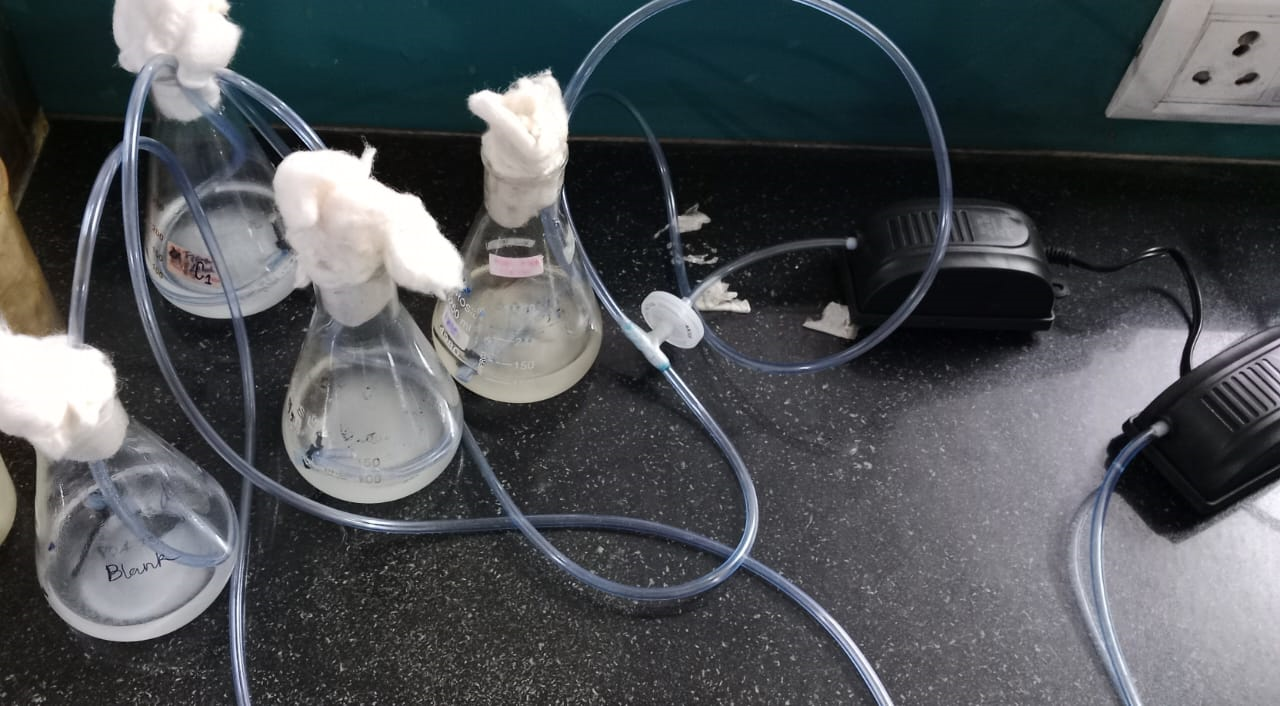
Fig 6.1: Setup of the Experiment: an air purifier was used to provide sterile air
Results:
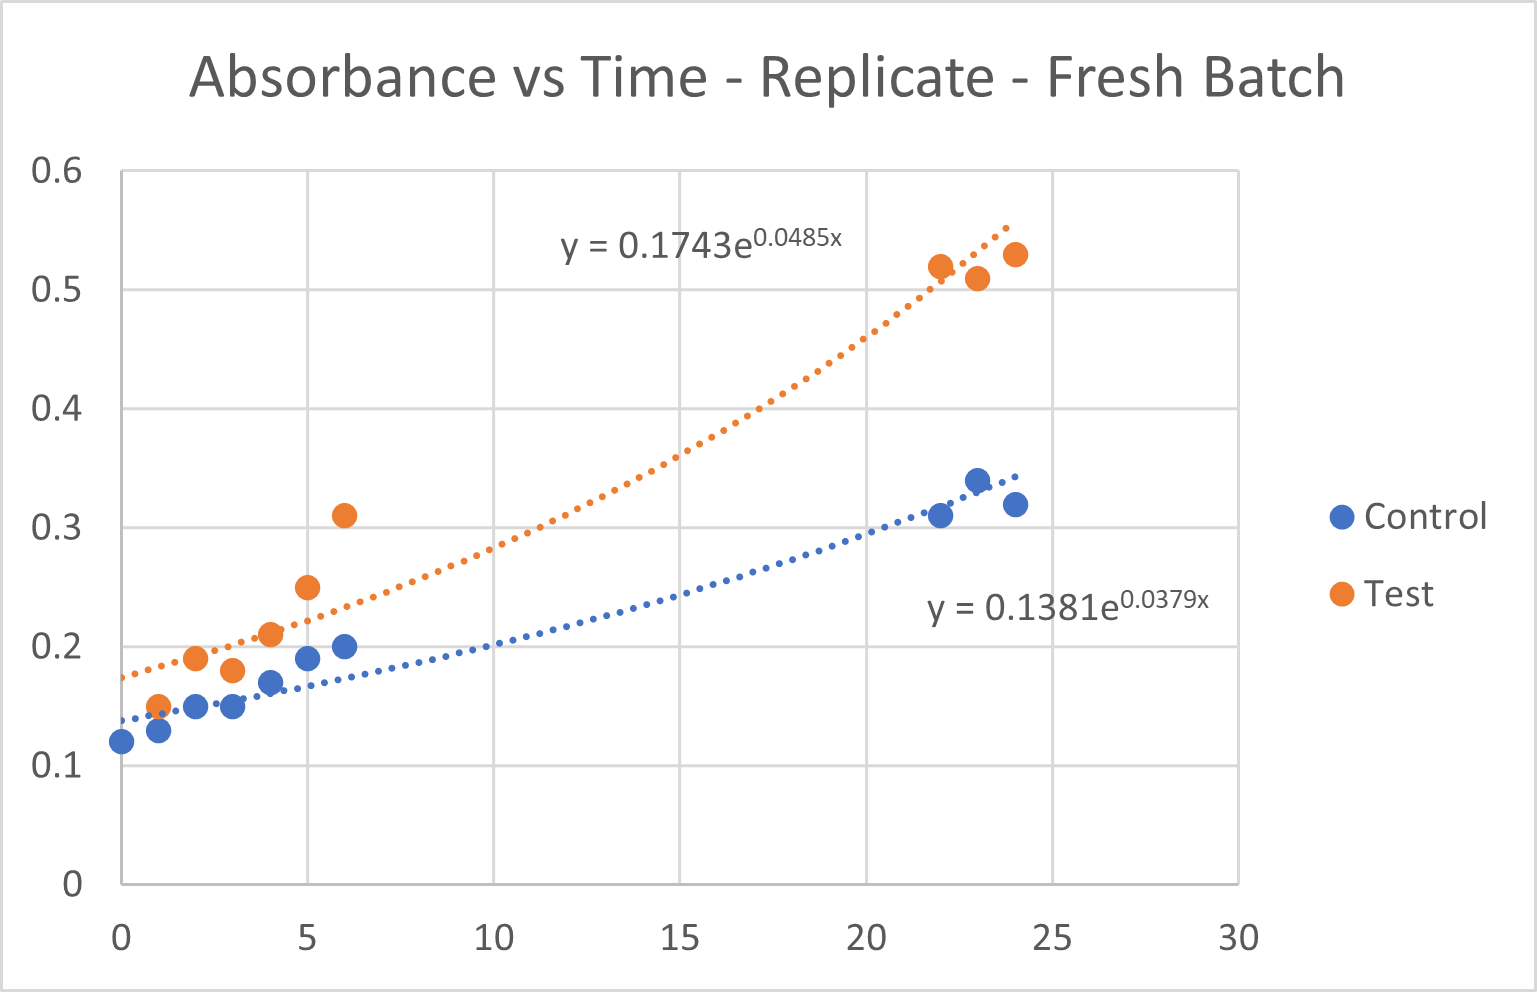
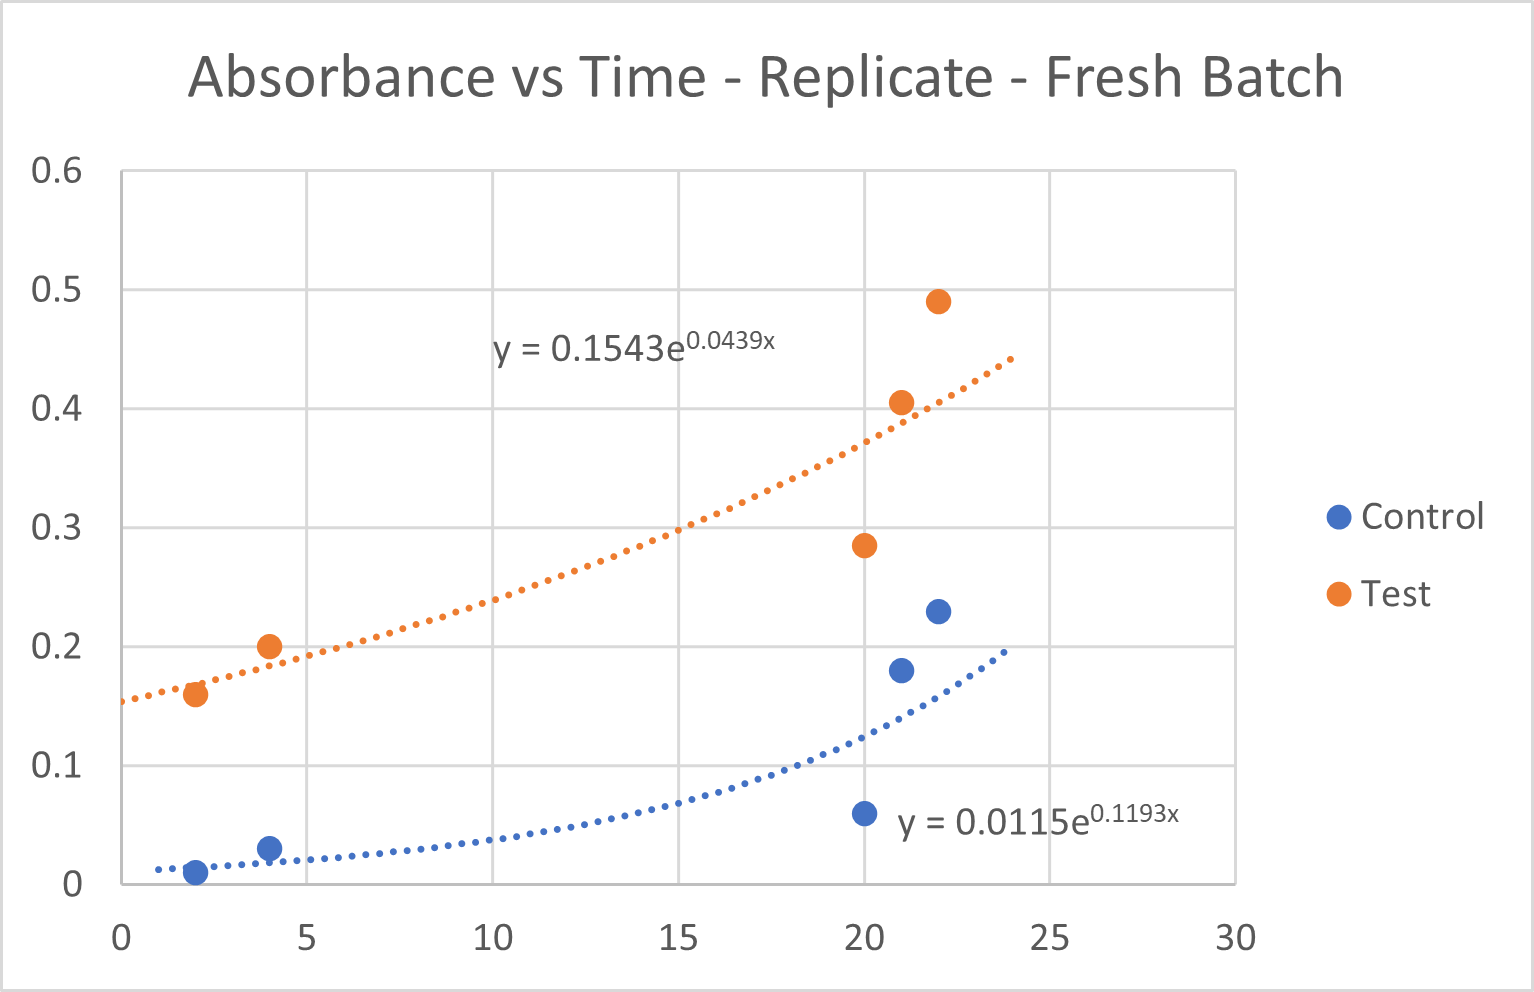
Fig 6.2: Growth Curve Analysis for the two replicate batches
- i. Growth rates were calculated for each group based on the replicate OD₆₀₀ readings at each time point. These CA-MNPs where magnetically seperated and reused.
- ii. The CA-MNP group demonstrated an accelerated increase in cell density compared to the control group, suggesting enhanced CO₂ utilization due to the immobilized CA thus proving its reusability.
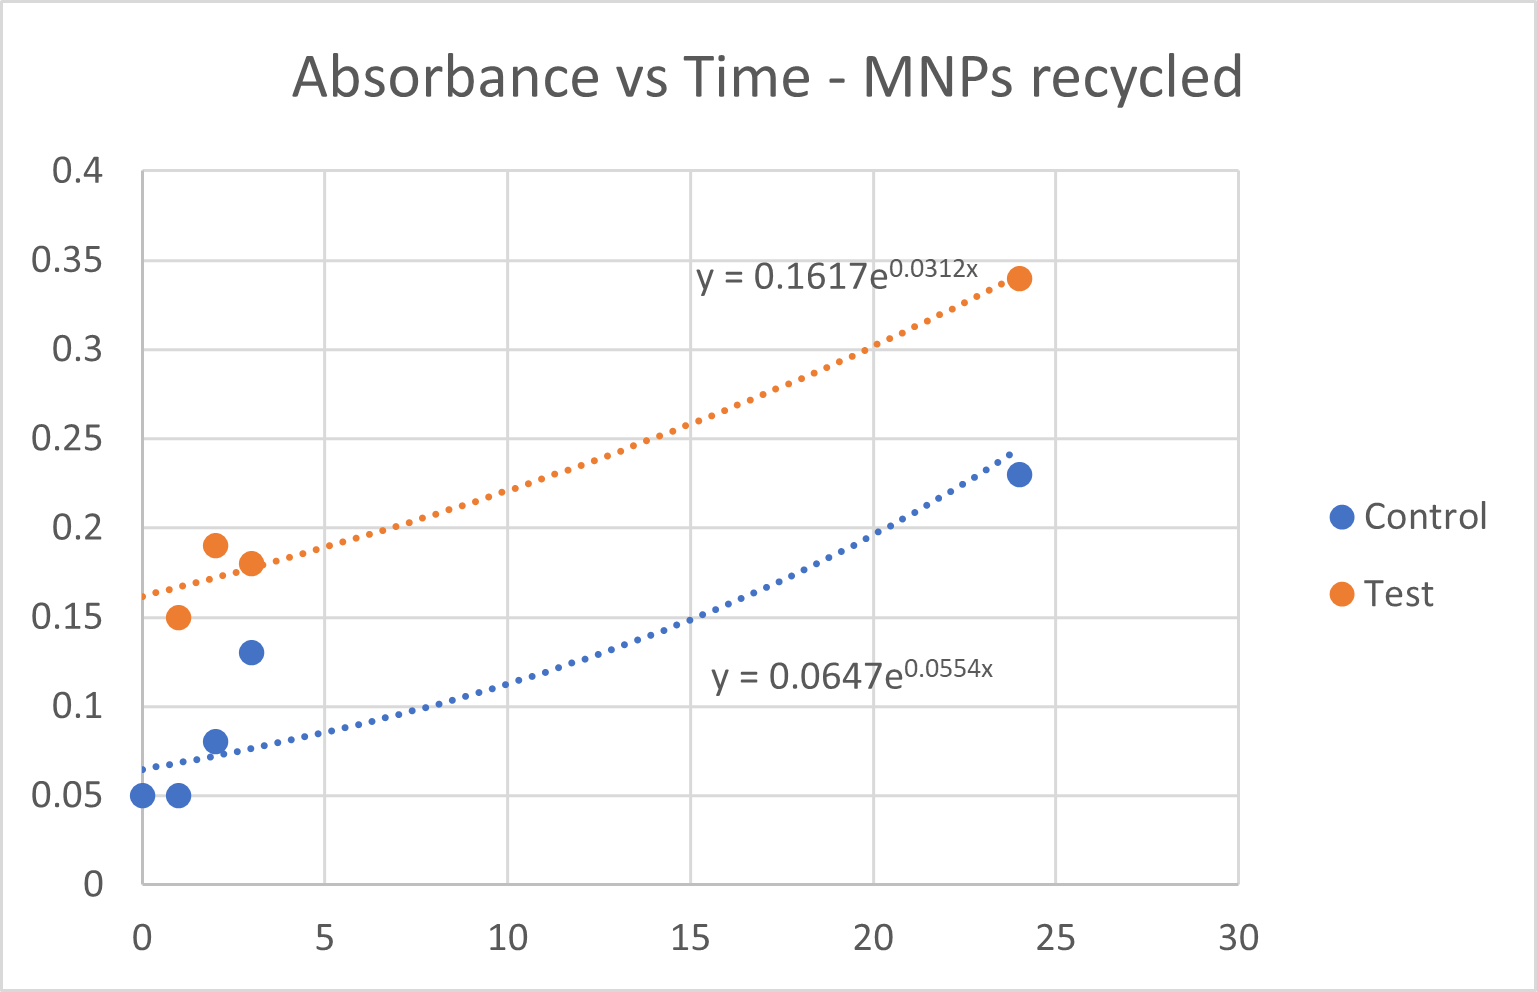
Fig 6.3: Growth Curve Analysis for MNPs that where magnetically separated and reused
An unpaired t-test was performed to compare the growth rates between the control group and the test group and assess whether the difference was statistically significant. The OD₆₀₀ at 22 hours for both replicates were:
- 1. Control Group: 0.31, 0.23
- 2. Test Group: 0.52, 0.49
An unpaired (independent) t-test was conducted with the following hypotheses:
- Null Hypothesis (H₀): There is no difference in growth rate between the control and test groups.
- Alternative Hypothesis (H₁): There is a significant difference in growth rate between the control and test groups, indicating that the CA immobilized MNPs increased growth rate.
- t-statistic: 5.50
- p-value: 0.031
With a p-value of 0.031 (below the 0.05 significance threshold), we reject the null hypothesis. This result indicates a statistically significant increase in growth rate in the presence of the of the CA immobilized MNPs.
7. Quantification of CO₂ captured and Determination of Efficacy:
To quantify the CO₂ capture facilitated by CA, we will calculate the amount of CO₂ converted into biomass in both the Control and CA-MNP groups. The following steps were followed:
-
Step 1. Conversion of OD to Dry Biomass: The final net absorbance of OD₆₀₀ readings correlates with biomass concentration. For E. coli, an OD₆₀₀ of 1.0 approximately equals 0.23 g/L of dry biomass (Yap & Trau, n.d.).
\(Biomass\ \left(\frac{g}{L}\right)={OD}_{600}×0.23\) \(\frac{g}{\text{L per OD unit}}\)
-
Step 2. Carbon Content in the Biomass: E. coli cells are 48% carbon by dry weight (Elemental Composition of Dry Mass of E. Coli, n.d.). The carbon content of the biomass is calculated as follows:
\(Carbon\ in\ Biomass\ \left(\frac{g}{L}\right)=Biomass\ \left(\frac{g}{L}\right)\times0.48\)
-
Step 3. Calculation of CO₂ Captured: During the growth of E. coli in minimal glucose media in the presence of air, the need for bicarbonate ions increases by 103 to 104 fold. It acts as a substrate for the reactions catalysed by the enzymes phosphoenolpyruvate carboxylase carbamoyl phosphate synthetase, 5-aminoimidazole ribotide carboxylase, and biotin carboxylase (Merlin et al., 2003). We are assuming the net change in carbon content is due to the conversion of CO₂ to bicarbonate (HCO3-). To determine the equivalent CO₂ captured, we convert the carbon content in biomass to CO₂.
\({CO}_2\ captured\ \left(\frac{g}{L}\right)=Carbon\ in\ Biomass\ \left(\frac{g}{L}\right)\times\frac{44}{12}\)
\(where,molar\ mass\ of\ {CO}_2=44\ \frac{g}{gmol}\)
\(and,\ molar\ mass\ of\ C=12\ \frac{g}{gmol}\)
-
Step 4. Comparison of CO₂ capture:
With CA-MNP (Experimental Group): Use the final biomass data from the CA-MNP group after 24 hours to calculate the CO₂ captured.
Without CA (Control): Calculate CO₂ capture for the Control group similarly.
Enhancement due to CA: To determine the CO₂ capture improvement, calculate the percentage increase as follows:
Enhancement = \(\frac{\text{(CO₂ captured with CA-MNP)-(CO₂ captured without CA)}}{\text{CO₂ captured without CA}}\times100\)
Sample Calculation:
- CA-MNP Final OD₆₀₀: 0.41
- Control Final OD₆₀₀: 0.20
For CA-MNP:
- Biomass: 0.41 × 0.23 = 0.0943 g/L
- Carbon in Biomass: 0.0943 × 0.48 = 0.04526 g/L
- CO₂ Captured: 0.04526 × (44/12) = 0.16597 g/L
For Control:
- Biomass: 0.20 × 0.23 = 0.046 g/L
- Carbon in Biomass: 0.046 × 0.48 = 0.02208 g/L
- CO₂ Captured: 0.02208 × (44/12) = 0.08096 g/L
Enhancement due to CA = \(\frac{0.16597-0.08096}{0.08096}\times100=\ 105\%\)
Results:
At the industrial scale, continuous-flow reactors are used to capture CO₂. The scale of photobioreactors can range from a few cubic meters to 100 cubic meters, depending on the scale of the plant. Hence, (using the value obtained from sample calculation) for 0.16597 g/L CO₂ captured per day, we can capture 16,596.8 g of CO₂ for a 100 cubic meters photobioreactor per day. Generally, annual maintenance checks require a complete system shutdown for 1 to 4 weeks. Including the same in the calculations, we get 5.59 tonnes of CO₂ per annum per photobioreactor. In a fully operating plant, multiple photobioreactors can be constructed to meet the standard norms and regulations for emissions of CO₂.
The average amount of CO₂ captured in the two fresh replicate batches using CA-MNPs is 0.182 g/L in a day. Hence, the average amount of CO₂ captured at industrial scale is 6.139 tonnes per annum in a 100 m3 photobioreactor. When the CA-MNPs are recycled and reused, the amount of CO₂ captured is 0.117 g/L in a day. Hence, the amount of CO₂ that will be captured at industrial scale is 3.956 tonnes per annum in a 100 m3 photobioreactor.
References
Elemental Composition of Dry Mass of E. Coli. (n.d.).
Merlin, C., Masters, M., McAteer, S., & Coulson, A. (2003). Why is carbonic anhydrase essential to Escherichia coli? Journal of Bacteriology, 185(21), 6415–6424. https://doi.org/10.1128/JB.185.21.6415-6424.2003
Yap, P. Y., & Trau, D. (n.d.). DIRECT E.COLI CELL COUNT AT OD₆₀₀.
https://www.yeastgenome.org/locus/S000004981
Aguilera J, Van Dijken JP, De Winde JH, Pronk JT. Carbonic anhydrase (Nce103p): an essential biosynthetic enzyme for growth of Saccharomyces cerevisiae at atmospheric carbon dioxide pressure. Biochem J. 2005 Oct 15;391(Pt 2):311-6. doi: 10.1042/BJ20050556. PMID: 15948716; PMCID: PMC1276929.
https://assets.thermofisher.com/TFS-Assets/LSG/manuals/pgapz_man.pdf
Kumar, S., Mannil, A., & Mutturi, S. (2020). Modified chemical method for efficient transformation and diagnosis in Pichia pastoris. Protein Expression and Purification, 105685. doi:10.1016/j.pep.2020.105685
Teng, Y. B., Jiang, Y. L., Chen, Y., & Zhou, C. Z. (2009). Crystal structure of Carbonic Anhydrase Nce103 from Saccharomyces cerevisiae. Worldwide Protein Data Bank. https://doi.org/10.2210/pdb3eyx/pdb
Ali, B. (2018). Carbon bio-sequestration by anhydrase enzyme extracted from spinach (Spinacia oleracea) (Doctoral dissertation).
Mascolo, M. C., Pei, Y., & Ring, T. A. (2013). Room temperature co-precipitation synthesis of magnetite nanoparticles in a large pH window with different bases. Materials, 6(12), 5549-5567.
Dheyab, M.A., Aziz, A.A., Jameel, M.S. et al. Simple rapid stabilization method through citric acid modification for magnetite nanoparticles. Sci Rep 10, 10793 (2020). https://doi.org/10.1038/s41598-020-67869-8
Carbonic Anhydrase - Assay. (n.d.). Worthington Biochemical. Retrieved November 14, 2024, from https://www.worthington-biochem.com/products/carbonic-anhydrase/assay